| Section |
Page |
| Contents |
3 |
| Chapter 1: Getting Started |
6 |
| Installation |
6 |
| Requirements |
6 |
| Install the software |
6 |
| Activate the software |
6 |
| Register |
7 |
| Read me |
7 |
| Viewing the files installed with Fireworks |
7 |
| Adobe Help |
7 |
| Adobe Help resources |
7 |
| Using Help in the product |
8 |
| How to choose the right Help documents |
9 |
| Resources |
9 |
| Adobe Video Workshop |
9 |
| Fireworks CS3 videos |
10 |
| Extras |
10 |
| Bridge Home |
11 |
| Adobe Design Center |
11 |
| Adobe Developer Center |
12 |
| Customer support |
12 |
| Downloads |
12 |
| Adobe Labs |
12 |
| User communities |
13 |
| What’s new in Fireworks CS3 |
13 |
| Chapter 2: Fireworks Basics |
17 |
| About working in Fireworks |
17 |
| Vector and bitmap objects |
17 |
| Interactive graphics |
18 |
| About optimizing and exporting graphics |
18 |
| About vector and bitmap graphics |
18 |
| About vector graphics |
19 |
| About bitmap graphics |
19 |
| Creating a new document |
20 |
| Opening and importing files |
21 |
| Opening recently closed documents |
21 |
| Opening graphics created in other applications |
21 |
| Animated GIFs |
22 |
| EPS files |
22 |
| PSD files |
22 |
| WBMP files |
22 |
| Creating Fireworks PNG files from HTML files |
22 |
| Inserting objects into a Fireworks document |
23 |
| Dragging images into Fireworks |
23 |
| Pasting into Fireworks |
24 |
| Location of pasted objects |
24 |
| Resampling pasted objects |
24 |
| Importing PNG files |
25 |
| Importing from a digital camera or scanner |
25 |
| Saving Fireworks files |
27 |
| Saving Fireworks PNG files |
27 |
| Saving documents in other formats |
28 |
| The Fireworks work environment |
29 |
| Using the Start page |
29 |
| Using the Tools panel |
30 |
| Changing tool options |
30 |
| Selecting a tool from a tool group |
31 |
| Using the Property inspector |
31 |
| Using panels |
32 |
| Organizing panel groups and panels |
33 |
| Using the panel group or panel Options menu |
35 |
| Saving panel layouts |
35 |
| About the Quick Export button |
36 |
| Opening and moving toolbars (Windows only) |
36 |
| Navigating and viewing documents |
36 |
| Using document tabs (Windows) |
36 |
| Zooming and panning |
37 |
| Using view modes to manage the workspace |
38 |
| Displaying multiple document views |
38 |
| Controlling document redraw |
39 |
| Changing the canvas |
39 |
| Changing canvas size, color, and resolution |
39 |
| About resampling |
41 |
| Rotating the canvas |
41 |
| Trimming or fitting the canvas |
41 |
| Cropping a document |
42 |
| Using context menus |
42 |
| Using rulers, guides, and the grid |
43 |
| Using rulers |
43 |
| Using guides |
43 |
| Using the grid |
44 |
| Using the History panel to undo and repeat multiple actions |
45 |
| Chapter 3: Selecting and Transforming Objects |
46 |
| Selecting objects |
46 |
| Using the Pointer tool |
46 |
| Using the Subselection tool |
47 |
| Using the Select Behind tool |
47 |
| Selection information in the Property inspector |
47 |
| Modifying a selection |
48 |
| Selecting pixels |
49 |
| Bitmap selection tool options |
49 |
| Creating pixel selection marquees |
50 |
| Plotting points to create a marquee selection |
50 |
| Selecting areas of similar color |
51 |
| Removing a selection marquee |
52 |
| Adjusting selection marquees |
52 |
| Moving or adjusting a marquee |
52 |
| Adding or subtracting pixels |
52 |
| Creating a marquee from intersecting marquees |
53 |
| Using thumbnails and modifier keys to modify pixel selections |
53 |
| Creating an inverse pixel selection |
54 |
| Feathering a pixel selection |
54 |
| Expanding or contracting a marquee |
54 |
| Selecting an area around an existing marquee |
55 |
| Smoothing the border of a marquee |
55 |
| Converting a marquee to a path |
55 |
| Transferring a marquee selection |
55 |
| Saving marquee selections |
56 |
| Restoring marquee selections |
56 |
| Deleting marquee selections |
57 |
| Creating and moving a floating pixel selection |
57 |
| Inserting a new bitmap by cutting or copying |
58 |
| Editing selected objects |
58 |
| Transforming and distorting selected objects and selections |
59 |
| Resizing (scaling) objects |
60 |
| Rotating objects |
60 |
| Flipping objects |
61 |
| Skewing objects |
61 |
| Distorting objects |
62 |
| Transforming objects numerically |
62 |
| Viewing transformation information in the Info panel |
62 |
| Organizing objects |
63 |
| Grouping objects |
63 |
| Selecting objects within groups |
63 |
| Stacking objects |
64 |
| Aligning objects |
64 |
| About arranging objects among layers |
65 |
| Chapter 4: Working with Bitmaps |
66 |
| Working with bitmaps |
66 |
| Creating bitmap objects |
66 |
| Accessing photo editing tools |
68 |
| Drawing, painting, and editing bitmap objects |
68 |
| Drawing bitmap objects |
68 |
| Painting bitmap objects |
69 |
| Sampling a color to use as a stroke or fill color |
69 |
| Erasing bitmap objects |
70 |
| Feathering pixel selections |
70 |
| Retouching bitmaps |
71 |
| Cloning pixels |
71 |
| Blurring, sharpening, and smudging pixels |
72 |
| Lightening and darkening pixels |
73 |
| Removing red-eye from photos |
73 |
| Replacing colors |
74 |
| Cropping a selected bitmap |
75 |
| Adjusting bitmap color and tone |
76 |
| Adjusting tonal range |
77 |
| Evening out highlights, midtones, and shadows |
77 |
| Adjusting tonal ranges automatically |
78 |
| Correcting colors using Curves |
79 |
| Correcting the tonal range using tonal eyedroppers |
80 |
| Adjusting brightness and contrast |
81 |
| Changing object colors |
81 |
| Adjusting hue and saturation |
82 |
| Inverting an image’s color values |
83 |
| Blurring and sharpening bitmaps |
84 |
| Blurring an image |
84 |
| Changing a bitmap into a line drawing |
85 |
| Converting an image to a transparency |
86 |
| Sharpening an image |
86 |
| Adding noise to an image |
88 |
| Chapter 5: Working with Vector Objects |
89 |
| Drawing vector objects |
89 |
| Drawing basic lines, rectangles, and ellipses |
89 |
| Drawing basic rounded rectangles |
90 |
| Drawing basic polygons and stars |
90 |
| Drawing Auto Shapes |
91 |
| Changing the properties of Auto Shapes |
93 |
| Adjusting arrow Auto Shapes |
93 |
| Adjusting bent arrow Auto Shapes |
94 |
| Adjusting beveled, chamfered, and rounded rectangle Auto Shapes |
94 |
| Adjusting connector line Auto Shapes |
95 |
| Adjusting doughnut Auto Shapes |
95 |
| Adjusting pie Auto Shapes |
95 |
| Adjusting L-shaped Auto Shapes |
96 |
| Adjusting smart polygon Auto Shapes |
96 |
| Adjusting spiral Auto Shapes |
96 |
| Adjusting star Auto Shapes |
97 |
| Adding Auto Shapes to drawings |
97 |
| Adding new Auto Shapes to Fireworks |
97 |
| Drawing freeform paths |
98 |
| Using the Vector Path tool |
98 |
| Drawing paths by plotting points |
99 |
| Drawing straight path segments |
99 |
| Drawing curved path segments |
100 |
| Adjusting the shape of a straight path segment |
100 |
| Adjusting the shape of a curved path segment |
101 |
| Converting path segments to straight or curved |
102 |
| Selecting points |
103 |
| Moving points and point handles |
103 |
| Inserting and deleting points on a path |
104 |
| Continuing an existing path |
104 |
| Merging two open paths |
104 |
| Auto-joining similar open paths |
105 |
| Editing paths |
105 |
| Editing with vector tools |
105 |
| Bending and reshaping vector objects |
105 |
| Distorting paths |
107 |
| Redrawing paths |
107 |
| Changing a path’s appearance by varying pressure and speed |
108 |
| Cutting paths into multiple objects |
108 |
| Editing with path operations |
108 |
| Combining path objects |
108 |
| Converting a path to a marquee selection |
109 |
| Creating an object from the intersection of other objects |
109 |
| Removing portions of a path object |
110 |
| Cropping a path |
110 |
| Simplifying a path |
110 |
| Expanding a stroke |
111 |
| Contracting or expanding a path |
111 |
| Editing paths using the Path panel |
112 |
| Chapter 6: Working with Text |
114 |
| Entering text |
114 |
| Naming a text object |
115 |
| Creating text blocks |
115 |
| Moving text blocks |
116 |
| Using auto-sizing and fixed-width text blocks |
116 |
| Formatting text |
117 |
| Choosing a font, size, and text style |
117 |
| Inserting special characters |
118 |
| Applying text color |
118 |
| Applying color to all text in selected text blocks |
118 |
| Applying color to highlighted text in a text block |
119 |
| Setting kerning |
119 |
| Setting leading |
120 |
| Setting text orientation |
121 |
| Setting text alignment |
121 |
| Indenting text |
122 |
| Setting paragraph spacing |
122 |
| Smoothing text edges |
123 |
| Adjusting character width |
123 |
| Setting baseline shift |
124 |
| Applying strokes, fills, and filters to text |
124 |
| Attaching text to a path |
125 |
| Editing paths and text attached to paths |
125 |
| Changing text orientation and direction on a path |
126 |
| Transforming text |
126 |
| Converting text to paths |
127 |
| Importing text |
127 |
| Photoshop text |
128 |
| RTF files |
128 |
| ASCII text |
128 |
| Handling missing fonts |
128 |
| Checking spelling |
129 |
| Customizing spell checking |
129 |
| Using the Text Editor |
130 |
| Chapter 7: Applying Color, Strokes, and Fills |
131 |
| Using the Colors section of the Tools panel |
131 |
| Organizing swatch groups and color models |
132 |
| Applying colors using the Swatches panel |
132 |
| Changing swatch groups |
133 |
| Customizing the Swatches panel |
133 |
| Clearing and sorting swatches |
134 |
| Creating colors in the Color Mixer |
134 |
| Mixing colors in the Color Mixer |
135 |
| Creating colors using the system color pickers |
136 |
| Viewing color values |
136 |
| Dithering with websafe colors |
137 |
| Color management using the Color Palette panel |
138 |
| Using color boxes and color pop-up windows |
140 |
| Selecting colors from a color pop-up window |
140 |
| Sampling colors from a color pop-up window |
141 |
| Working with strokes |
141 |
| Applying strokes |
141 |
| Creating custom strokes |
143 |
| Placing strokes on paths |
144 |
| Creating stroke styles |
145 |
| Working with fills |
145 |
| Setting fill attributes of the drawing tools |
145 |
| Editing solid fills |
146 |
| Applying gradient and pattern fills |
146 |
| Applying a pattern fill |
146 |
| Adding a custom pattern |
147 |
| Applying a gradient fill |
147 |
| Editing a gradient fill |
147 |
| Creating fills with the Gradient tool |
148 |
| Transforming and distorting fills |
149 |
| Setting hard-edged, anti-aliased, or feathered fill edges |
149 |
| About saving a custom gradient fill |
150 |
| Removing a fill |
150 |
| Adding texture to strokes and fills |
150 |
| Adding texture to a stroke |
150 |
| Adding texture to a fill |
151 |
| Adding a custom texture |
151 |
| Chapter 8: Using Live Filters |
152 |
| Applying Live Filters |
152 |
| Applying beveled edges |
154 |
| Applying embossing |
154 |
| Applying shadows and glows |
154 |
| Applying filters and Photoshop plug-ins as Live Filters |
155 |
| Plug-ins from the Filters menu |
156 |
| Installing Photoshop plug-ins |
156 |
| Applying Photoshop layer effects |
156 |
| About applying filters to grouped objects |
156 |
| Editing Live Filters |
157 |
| Reordering Live Filters |
157 |
| Removing Live Filters |
157 |
| Creating custom Live Filters |
157 |
| Saving Live Filters as commands |
158 |
| Chapter 9: Pages, Layers, Masking, and Blending |
160 |
| Working with pages |
160 |
| Adding and removing pages |
161 |
| Editing pages |
161 |
| Using a master page |
162 |
| Exporting pages to HTML |
162 |
| Exporting pages as image files |
163 |
| Working with layers |
164 |
| Activating layers |
164 |
| Adding and removing layers |
165 |
| Viewing layers |
166 |
| Organizing layers |
166 |
| Protecting layers and objects |
167 |
| Merging objects in the Layers panel |
167 |
| Sharing layers |
168 |
| Using the Web Layer |
168 |
| About importing Photoshop grouped layers |
169 |
| Masking images |
169 |
| About masks |
169 |
| About vector masks |
169 |
| About bitmap masks |
170 |
| Creating a mask from an existing object |
171 |
| Masking objects using the Paste as Mask command |
171 |
| Masking objects using the Paste Inside command |
172 |
| Using text as a mask |
174 |
| Masking objects using the Layers panel |
174 |
| Masking objects using the Reveal and Hide commands |
175 |
| About importing and exporting Photoshop layer masks |
176 |
| Grouping objects to form a mask |
177 |
| Editing masks |
178 |
| Selecting masks and masked objects using mask thumbnails |
178 |
| Selecting masks and masked objects using the Subselection tool |
178 |
| Moving masks and masked objects |
179 |
| Modifying a mask’s appearance |
180 |
| Changing the way masks are applied |
181 |
| Adding objects to a masked selection |
183 |
| Replacing, disabling, and deleting masks |
183 |
| Blending and transparency |
184 |
| About blending modes |
184 |
| Blending mode examples |
185 |
| Adjusting opacity and applying blends |
186 |
| About the Color Fill Live Filter |
187 |
| Chapter 10: Using Styles, Symbols, and URLs |
188 |
| Using styles |
188 |
| Applying a style |
188 |
| Creating and deleting styles |
189 |
| Editing styles |
190 |
| Exporting and importing styles |
190 |
| Using style defaults |
191 |
| Applying attributes without creating a style |
191 |
| Using symbols |
191 |
| Creating a symbol |
191 |
| Placing instances |
192 |
| Editing symbols |
192 |
| Using 9-slice scaling |
193 |
| Creating and using rich graphic symbols |
195 |
| Creating editable symbol parameters using JavaScript: |
196 |
| Editing instances |
198 |
| Editing rich symbols |
198 |
| Breaking symbol links |
198 |
| Editing instance properties |
198 |
| Importing and exporting symbols |
199 |
| Importing symbols |
199 |
| Exporting symbols |
200 |
| Updating exported symbols and instances in multiple documents |
200 |
| Working with URLs |
201 |
| About absolute and relative URLs |
201 |
| Working with pages |
202 |
| Assigning a URL to a web object |
202 |
| Creating a URL library |
202 |
| Editing URLs |
203 |
| Importing and exporting URLs |
203 |
| Chapter 11: Slices, Rollovers, and Hotspots |
205 |
| Creating and editing slices |
205 |
| Creating slice objects |
206 |
| Creating HTML slices |
206 |
| Creating nonrectangular slices |
207 |
| Viewing and displaying slices and slice guides |
208 |
| Viewing slices in the Layers panel |
208 |
| Showing and hiding slices |
208 |
| Changing slice and slice guide color |
208 |
| Editing slices |
209 |
| Moving slice guides to edit slices |
209 |
| Using tools to edit slice objects |
210 |
| About using the Property inspector or Info panel to edit slice objects |
210 |
| Making slices interactive |
210 |
| Adding simple interactivity to slices |
211 |
| About rollovers |
211 |
| Creating a simple rollover |
212 |
| Creating a disjoint rollover |
213 |
| Applying multiple rollovers to a slice |
213 |
| Removing a drag-and-drop rollover |
214 |
| Using the Behaviors panel to add interactivity to slices |
214 |
| Attaching behaviors |
215 |
| Editing behaviors |
215 |
| Using external image files for swap image |
216 |
| Preparing slices for export |
216 |
| Assigning URLs |
217 |
| Entering alternate text |
217 |
| Assigning a target |
217 |
| Export settings |
218 |
| Naming slices |
218 |
| Custom-naming slice files |
218 |
| Auto-naming slice files |
218 |
| Changing the default auto-naming convention |
218 |
| Defining how HTML tables are exported |
220 |
| Working with hotspots and image maps |
221 |
| Creating hotspots |
221 |
| Editing hotspots |
222 |
| Preparing hotspots for export |
222 |
| Creating image maps |
223 |
| Creating rollovers with hotspots |
223 |
| Using hotspots on top of slices |
224 |
| Chapter 12: Creating Buttons and Pop-up Menus |
225 |
| Creating button symbols |
225 |
| About button states |
226 |
| Using the Button Editor |
226 |
| Creating a simple two-state button |
226 |
| Creating a three- or four-state button |
227 |
| Using bevel filters to draw button states |
227 |
| Converting Fireworks rollovers into buttons |
228 |
| Inserting buttons into a document |
228 |
| Importing button symbols |
229 |
| Editing button symbols |
229 |
| Editing symbol-level properties |
229 |
| Editing instance-level properties |
230 |
| Setting interactive button properties |
231 |
| Modifying the active area of a button symbol |
231 |
| Setting the URL for a button symbol or instance |
231 |
| Setting the target for a button |
232 |
| Setting the alternate (alt) text for a button symbol or instance |
233 |
| Creating navigation bars |
233 |
| Creating pop-up menus |
234 |
| About the Pop-up Menu Editor |
234 |
| Creating a basic pop-up menu |
235 |
| Creating submenus within a pop-up menu |
236 |
| Designing the appearance of a pop-up menu |
237 |
| Adding pop-up menu styles |
238 |
| Setting advanced pop-up menu properties |
239 |
| Positioning pop-up menus and submenus |
240 |
| Editing pop-up menus |
241 |
| About exporting pop-up menus |
242 |
| Chapter 13: Creating Animations |
243 |
| Building animation |
243 |
| Working with animation symbols |
244 |
| Creating animation symbols |
244 |
| Editing animation symbols |
245 |
| Changing animation properties |
245 |
| Removing animations |
246 |
| Editing symbol graphics |
246 |
| Editing symbol motion paths |
246 |
| Working with frames |
247 |
| Setting the frame delay |
247 |
| Showing and hiding frames for playback |
248 |
| Naming animation frames |
248 |
| Adding, moving, copying, and deleting frames |
248 |
| Moving selected objects in the Frames panel |
249 |
| Sharing layers across frames |
249 |
| Viewing objects in a specific frame |
250 |
| Using onion skinning |
250 |
| Tweening |
251 |
| Previewing an animation |
251 |
| Exporting your animation |
252 |
| Setting the animation repetition |
252 |
| Setting transparency |
252 |
| Optimizing an animation |
253 |
| Animation export formats |
253 |
| Working with existing animations |
253 |
| Using multiple files as one animation |
254 |
| Chapter 14: Creating Slideshows |
255 |
| The Create Slideshow command |
255 |
| Building or editing a slideshow |
255 |
| Slideshow properties |
257 |
| AlbumBook Properties panel |
257 |
| Album Properties panel |
258 |
| Captions panel |
258 |
| Filters panel |
258 |
| Slideshow Properties panel |
259 |
| Export Options panel |
259 |
| Creating a custom Fireworks album player |
259 |
| Node definitions |
260 |
| Chapter 15: Optimizing and Exporting |
262 |
| About optimizing |
262 |
| Using the Export Wizard |
263 |
| Using Image Preview |
263 |
| Optimizing in the workspace |
266 |
| Using optimization settings |
267 |
| Previewing and comparing optimization settings |
268 |
| Choosing a file type |
270 |
| Optimizing GIF, PNG, TIFF, BMP, and PICT files |
270 |
| Choosing a color palette |
271 |
| Setting the color depth |
271 |
| Removing unused colors |
272 |
| Dithering to approximate lost colors |
272 |
| Viewing colors in a palette |
273 |
| Locking colors in a palette |
274 |
| Editing colors in a palette |
274 |
| Using websafe colors |
275 |
| Saving palettes |
275 |
| Adjusting compression |
275 |
| Making areas transparent |
276 |
| Interlacing: Downloading gradually |
277 |
| Optimizing JPEGs |
277 |
| Adjusting JPEG quality |
278 |
| Selectively compressing areas of a JPEG |
278 |
| Blurring or sharpening detail |
279 |
| Using progressive JPEGs |
279 |
| Matching a target background color |
279 |
| Removing halos |
280 |
| Saving and reusing optimization settings |
280 |
| Exporting from Fireworks |
281 |
| Exporting a single image |
282 |
| Exporting a sliced document |
282 |
| Exporting selected slices |
283 |
| Updating a slice |
283 |
| Exporting an animation |
284 |
| Exporting frames or layers |
284 |
| Exporting an area |
285 |
| Exporting HTML |
285 |
| About HTML |
286 |
| Including comments in HTML |
286 |
| Results of exporting |
286 |
| Exporting Fireworks HTML |
287 |
| Copying HTML to the Clipboard |
288 |
| Copying and pasting HTML from an exported Fireworks file |
289 |
| Updating exported HTML |
290 |
| Exporting CSS layers |
290 |
| Exporting XHTML |
291 |
| Exporting files with and without UTF-8 encoding |
291 |
| Setting HTML export options |
292 |
| Using the Quick Export button |
293 |
| Customizing the Quick Export pop-up menu |
294 |
| Sending a Fireworks document as an e-mail attachment |
294 |
| Using the File Management button |
294 |
| Chapter 16: Using Fireworks with Other Applications |
296 |
| Working with Dreamweaver |
297 |
| Placing Fireworks images in Dreamweaver files |
297 |
| Creating new Fireworks files from Dreamweaver placeholders |
297 |
| Placing Fireworks HTML code in Dreamweaver |
299 |
| Exporting Fireworks HTML to Dreamweaver |
300 |
| Copying Fireworks HTML code to the Clipboard for use in Dreamweaver |
300 |
| Copying code from an exported Fireworks file and pasting it into Dreamweaver |
301 |
| Updating Fireworks HTML exported to Dreamweaver |
301 |
| Exporting Fireworks files to Dreamweaver libraries |
301 |
| Editing Fireworks files from Dreamweaver |
302 |
| About Roundtrip HTML |
303 |
| Editing Fireworks images |
303 |
| Editing Fireworks tables |
304 |
| About Dreamweaver behaviors |
304 |
| Optimizing Fireworks images and animations placed in Dreamweaver |
305 |
| Changing animation settings |
306 |
| Setting launch-and-edit options |
307 |
| Designating Fireworks as the primary external image editor for Dreamweaver |
307 |
| About Design Notes and source files |
308 |
| Specifying launch-and-edit preferences for Fireworks source files |
308 |
| Using the File Management button |
309 |
| Working with Flash |
310 |
| Placing Fireworks graphics in Flash |
310 |
| Importing Fireworks PNG files into Flash |
310 |
| Copying and pasting Fireworks graphics into Flash |
312 |
| About the Flash library structure |
313 |
| About importing symbols that have 9-slice scaling |
313 |
| About importing rich graphic symbols |
314 |
| About preserving Photoshop layer effects |
314 |
| About preserving visibility and locking |
314 |
| About exporting Fireworks graphics to other formats for use in Flash |
314 |
| Exporting Fireworks graphics and animations as SWF files |
315 |
| Exporting PNG files with transparency |
316 |
| Importing exported Fireworks graphics and animations into Flash |
316 |
| Using Fireworks to edit graphics imported into Flash |
317 |
| Working with FreeHand |
317 |
| Placing FreeHand graphics in Fireworks |
317 |
| Importing FreeHand graphics into Fireworks |
317 |
| Copying and pasting or dragging FreeHand graphics into Fireworks |
318 |
| Placing Fireworks graphics in FreeHand |
319 |
| Importing Fireworks graphics into FreeHand |
319 |
| Copying and pasting Fireworks graphics into Freehand |
320 |
| Copying and pasting Fireworks paths into FreeHand |
320 |
| Exporting Fireworks graphics to FreeHand |
321 |
| Working with other vector graphics applications |
321 |
| Unsupported features |
321 |
| Working with Director |
322 |
| Placing Fireworks files in Director |
322 |
| Exporting graphics with transparency |
322 |
| Exporting layered and sliced content to Director |
322 |
| Importing Fireworks files into Director |
323 |
| Editing Director cast members in Fireworks |
324 |
| Optimizing cast members in Director |
324 |
| Working with HomeSite |
325 |
| Placing Fireworks images in HomeSite |
325 |
| Placing Fireworks HTML in HomeSite |
325 |
| Exporting Fireworks HTML to HomeSite |
325 |
| Copying Fireworks HTML to the Clipboard for use in HomeSite |
326 |
| Copying code from an exported Fireworks file and pasting it into HomeSite |
326 |
| Updating Fireworks HTML exported to HomeSite |
326 |
| Editing Fireworks images in HomeSite |
326 |
| Working with Photoshop |
327 |
| Placing Photoshop graphics in Fireworks |
327 |
| Dragging individual Photoshop graphics into Fireworks |
327 |
| Importing Photoshop files into Fireworks |
327 |
| About importing text from Photoshop |
328 |
| Specifying Photoshop file import options |
328 |
| Using Photoshop filters and plug-ins |
329 |
| Placing Fireworks graphics in Photoshop |
330 |
| Customizing files for export to Photoshop |
330 |
| About working with Illustrator |
331 |
| About working with GoLive |
332 |
| About working with HTML editors |
332 |
| About extending Fireworks |
333 |
| About Adobe XMP |
333 |
| About Adobe Bridge |
333 |
| Flex integration for rich Internet application layouts (MXML export) |
334 |
| Chapter 17: Automating Repetitive Tasks |
335 |
| Finding and replacing |
335 |
| Setting options for finding and replacing in multiple files |
337 |
| Finding and replacing text |
337 |
| Finding and replacing fonts |
337 |
| Finding and replacing colors |
338 |
| Finding and replacing URLs |
338 |
| Finding and replacing non-websafe colors |
338 |
| Batch processing |
339 |
| Changing optimization settings with a batch process |
342 |
| Scaling graphics with a batch process |
343 |
| Finding and replacing during a batch process |
343 |
| Changing filenames with a batch process |
344 |
| Performing commands with a batch process |
344 |
| Specifying the batch process output location |
345 |
| Saving batch processes as scripts |
345 |
| Running scripts by dragging and dropping |
346 |
| Extending Fireworks |
346 |
| Using the Adobe Extension Manager |
347 |
| Scripting with the History panel |
347 |
| About scripting with JavaScript |
348 |
| About scripting with Flash SWF files |
349 |
| Managing commands |
349 |
| Editing or customizing a command script |
349 |
| Flash SWF movies used as Fireworks panels |
350 |
| Chapter 18: Preferences and Keyboard Shortcuts |
351 |
| Setting preferences |
351 |
| General preferences |
351 |
| Editing preferences |
352 |
| Launch and Edit preferences |
352 |
| Folders preferences |
353 |
| Photoshop Import preferences |
353 |
| Restoring preferences |
353 |
| Changing keyboard shortcut sets |
354 |
| Creating custom and secondary shortcuts |
354 |
| Deleting custom shortcuts and custom shortcut sets |
355 |
| Creating a reference sheet for the current shortcut set |
355 |
| Working with configuration files |
355 |
| About user configuration files |
356 |
| About master configuration files that affect all users |
356 |
| Location of the Fireworks preferences file |
356 |
| About reinstalling Fireworks |
356 |
| Viewing package contents (Macintosh only) |
357 |
| Index |
358 |
| Numerics |
358 |
| 24-bit color 267 |
358 |
| 32-bit color 267 |
358 |
| A |
358 |
| absolute URLs, entering 196 |
358 |
| accessibility |
358 |
| of Help 3 |
358 |
| ACT file format, swatches 128 |
358 |
| ACT file, exporting 133 |
358 |
| activation of software 1 |
358 |
| Add Filters pop-up menu 147 |
358 |
| Add Noise filter 83 |
358 |
| Add Preview Icons preference 347 |
358 |
| adding |
358 |
| frames 243 |
358 |
| pages 156 |
358 |
| styles 184 |
358 |
| adjusting |
358 |
| hue or saturation 77 |
358 |
| tonal range using eyedropper 75 |
358 |
| Adobe Bridge 328 |
358 |
| Adobe Bridge Home 6 |
358 |
| Adobe Design Center 6 |
358 |
| Adobe Fireworks |
358 |
| system requirements 1 |
358 |
| Adobe Flex Builder 329 |
358 |
| Adobe GoLive 288 |
358 |
| Adobe Help 2 |
358 |
| Adobe Video Workshop 4 |
358 |
| Adobe XMP 328 |
358 |
| Align panel 28 |
358 |
| aligning objects 59 |
358 |
| alpha channel of an object, selecting 48 |
358 |
| alpha, converting images to 81 |
358 |
| alt (alternate) text 212 |
358 |
| assigning to buttons or instances 228 |
358 |
| animation 238 |
358 |
| adding frames 243 |
358 |
| creating from multiple files 249 |
358 |
| custom frame viewing 246 |
358 |
| deleting frames 244 |
358 |
| disabling layer sharing 245 |
358 |
| editing 301 |
358 |
| exporting 248 |
358 |
| frames 240 |
358 |
| inserting frames 243 |
358 |
| looping 247 |
358 |
| managing frames 242 |
358 |
| movement 240 |
358 |
| moving objects to another frame 244 |
358 |
| multiframe editing 246 |
358 |
| naming frames 243 |
358 |
| onion skinning 245 |
358 |
| opacity 240 |
358 |
| opening 248 |
358 |
| optimizing 248 |
358 |
| playing 246 |
358 |
| previewing 246 |
358 |
| properties 239 |
358 |
| removing 241 |
358 |
| reordering frames 244 |
358 |
| rotation 240 |
358 |
| scaling 240 |
358 |
| setting frame delay 242 |
358 |
| sharing layers across frames 244 |
358 |
| transparency 247 |
358 |
| turning frames on and off 243 |
358 |
| viewing all frames 246 |
358 |
| viewing current and adjacent frames 246 |
358 |
| viewing multiple frames 245 |
358 |
| viewing next frame 246 |
358 |
| anti-aliasing |
358 |
| edges 144 |
358 |
| removing halos 275 |
358 |
| smoothing text edges 118 |
358 |
| target background color 274 |
358 |
| application program package 352 |
358 |
| arranging frames 244 |
358 |
| Arrow tool 86 |
358 |
| Auto Levels feature for adjusting tonal range 72 |
358 |
| Auto Shapes 86, 87, 88, 92 |
358 |
| Auto Shapes Properties panel 28 |
358 |
| auto-naming slices 213 |
358 |
| changing default naming convention 214 |
358 |
| B |
358 |
| backing up during Find and Replace 332 |
358 |
| baseline shift 119 |
358 |
| Batch Process dialog box 334 |
358 |
| batch processing 334 |
358 |
| backing up files 340 |
358 |
| commands 339 |
358 |
| export settings 337 |
358 |
| filenames 339 |
358 |
| Find and Replace 338 |
358 |
| optimization settings 337 |
358 |
| saving as scripts 340 |
358 |
| saving files 336 |
358 |
| scaling graphics 338 |
358 |
| batch scripts 340 |
358 |
| dragging and dropping 341 |
358 |
| running 341 |
358 |
| behaviors 210 |
358 |
| Behaviors panel 209 |
358 |
| Dreamweaver 206 |
358 |
| Nav Bar Down 210 |
358 |
| Nav Bar Over 210 |
358 |
| Nav Bar Restore 210 |
358 |
| Set Nav Bar Image 210 |
358 |
| Set Pop-up Menu 210 |
358 |
| Set Text of Status Bar 210 |
358 |
| Simple Rollover 209 |
358 |
| Swap Image 209 |
358 |
| Behaviors panel 28, 209 |
358 |
| beveled edges 149 |
358 |
| Beveled Rectangle tool 86 |
358 |
| bicubic interpolation scaling method 346 |
358 |
| bilinear interpolation scaling method 346 |
358 |
| bitmap graphics 14 |
358 |
| bitmap masks 164, 165 |
358 |
| creating 169 |
358 |
| using an existing object as 167, 169 |
358 |
| bitmap mode 12 |
358 |
| applying with tools 25 |
358 |
| switching to 61 |
359 |
| bitmaps |
359 |
| adjusting brightness and contrast 76 |
359 |
| adjusting color and tone 71 |
359 |
| adjusting hue and saturation 77 |
359 |
| blurring and sharpening 79 |
359 |
| erasing 65 |
359 |
| retouching 66 |
359 |
| blending |
359 |
| applying 181 |
359 |
| colors of overlapping objects 179 |
359 |
| objects 246 |
359 |
| setting blending mode 181 |
359 |
| blending colors 135 |
359 |
| blending modes 179 |
359 |
| Color 180 |
359 |
| Darken 179 |
359 |
| Difference 180 |
359 |
| Erase 180 |
359 |
| Hard Mix 180 |
359 |
| Hue 180 |
359 |
| Invert 180 |
359 |
| Lighten 179 |
359 |
| Linear Burn 179 |
359 |
| Linear Dodge 179 |
359 |
| Linear Light 179 |
359 |
| Luminosity 180 |
359 |
| Multiply 179 |
359 |
| Pin Light 180 |
359 |
| Saturation 180 |
359 |
| Screen 179 |
359 |
| Tint 180 |
359 |
| Vivid Light 179 |
359 |
| Blur filter 79 |
359 |
| Blur More filter 79 |
359 |
| Blur tool 66 |
359 |
| blurring 79 |
359 |
| bitmap areas 66 |
359 |
| images 67 |
359 |
| BMP file format 265 |
359 |
| BMP, saving 23 |
359 |
| bold text 112 |
359 |
| Border command 50 |
359 |
| boundaries 136 |
359 |
| Bridge Home 6 |
359 |
| Bridge, Adobe 328 |
359 |
| brightness 76 |
359 |
| Brightness/Contrast filter 76 |
359 |
| Bring Forward command 59 |
359 |
| Bring to Front command 59 |
359 |
| Brush tool 64, 93 |
359 |
| brushes |
359 |
| saving settings 140 |
359 |
| setting tip 139 |
359 |
| stroke options 138 |
359 |
| Brush-size Painting Cursors preference 347 |
359 |
| Burn tool 66 |
359 |
| Button Editor 221 |
359 |
| creating symbols in 187 |
359 |
| editing symbols in 193 |
359 |
| button states |
359 |
| Down 221, 222 |
359 |
| Over 221 |
359 |
| Over While Down 221, 222 |
359 |
| Up 221 |
359 |
| button symbols |
359 |
| editing 224 |
359 |
| inserting in a document 223 |
359 |
| buttons |
359 |
| active area 226 |
359 |
| Button Editor 220 |
359 |
| creating 220 |
359 |
| defined 221 |
359 |
| Live Filters 222 |
359 |
| navigation bars 228 |
359 |
| overview 220 |
359 |
| setting a target 227 |
359 |
| C |
359 |
| canvas 34 |
359 |
| modifying characteristics 34 |
359 |
| modifying resolution 35 |
359 |
| rotating 36 |
359 |
| trimming 36 |
359 |
| cell border properties 234 |
359 |
| cellular phone graphics. See WBMP files |
359 |
| center point and axis of rotation 56 |
359 |
| Chamfer Rectangle tool 87 |
359 |
| character spacing. See kerning |
359 |
| Check Spelling command 124 |
359 |
| cloning |
359 |
| bitmap areas 66 |
359 |
| images 66 |
359 |
| objects 54 |
359 |
| CMY color model 130 |
359 |
| collapsing layers 161 |
359 |
| color |
359 |
| adjusting 71 |
359 |
| applying from Swatches panel 127 |
359 |
| changing 64 |
359 |
| changing stroke 137 |
359 |
| choosing color depth 266 |
359 |
| choosing swatch group 128 |
359 |
| choosing using Eyedropper tool 136 |
359 |
| color models 130 |
359 |
| creating in Color Mixer 131 |
359 |
| creating with system color picker 131 |
359 |
| deleting from Swatches panel 129 |
359 |
| dithering with websafe 132 |
359 |
| fills 76 |
359 |
| finding and replacing 333 |
359 |
| finding and replacing non- websafe 333 |
359 |
| gradient fills 142 |
359 |
| inverting values 78 |
359 |
| picking from color bar 130 |
359 |
| pop-up window 135 |
359 |
| removing unused 267 |
359 |
| replacing a swatch 129 |
359 |
| resetting default 127 |
359 |
| sampling 64, 136 |
359 |
| saving custom swatches 129 |
359 |
| setting preferences 346 |
359 |
| viewing color values 131 |
359 |
| color bar 127, 129 |
359 |
| choosing a color with 130 |
359 |
| cycling through color models 131 |
359 |
| color blending 135 |
359 |
| color correction |
359 |
| brightness and contrast 76 |
359 |
| Curves 74 |
359 |
| Levels 72 |
359 |
| using eyedropper 75 |
359 |
| Color Mixer 28, 129, 130 |
359 |
| creating colors with 131 |
359 |
| displaying 130 |
359 |
| mixing colors in 130 |
359 |
| resetting default colors in 127 |
359 |
| swapping stroke and fill colors in 127 |
359 |
| color models |
359 |
| CMY 130 |
359 |
| Grayscale 130 |
359 |
| Hexadecimal 130 |
360 |
| HSB 130 |
360 |
| RGB 130 |
360 |
| Color Palette panel 133 |
360 |
| color palettes |
360 |
| Adaptive 266 |
360 |
| appending to current swatches 128 |
360 |
| Black and White 266 |
360 |
| Custom 266 |
360 |
| editing 269 |
360 |
| Exact 266 |
360 |
| Grayscale 266 |
360 |
| importing 266 |
360 |
| locking colors 269 |
360 |
| optimizing 269 |
360 |
| saving 270 |
360 |
| setting number of colors 266 |
360 |
| System (Macintosh) 266 |
360 |
| System (Windows) 266 |
360 |
| Uniform 266 |
360 |
| viewing 268 |
360 |
| Web 216 266 |
360 |
| WebSnap Adaptive 266 |
360 |
| color palettes, swapping 134 |
360 |
| color picker, system 131 |
360 |
| color table 268 |
360 |
| edited swatch in 268 |
360 |
| locked swatch in 268 |
360 |
| selecting colors in 268 |
360 |
| swatch with multiple attributes in 268 |
360 |
| transparent swatch in 268 |
360 |
| updating 268 |
360 |
| websafe swatch in 268 |
360 |
| colorizing images 77 |
360 |
| command scripts, editing 344 |
360 |
| commands |
360 |
| batch processing 339 |
360 |
| creating 342 |
360 |
| deleting custom 344 |
360 |
| editing 344 |
360 |
| renaming custom 344 |
360 |
| renaming or deleting Adobe Fireworks commands 344 |
360 |
| saving 40 |
360 |
| Commands menu 343 |
360 |
| managing saved commands 344 |
360 |
| composite paths 104 |
360 |
| compositing 179 |
360 |
| compression |
360 |
| adjusting 270 |
360 |
| and optimization 261 |
360 |
| blurring edges 274 |
360 |
| choosing a file type 265 |
360 |
| selective 273 |
360 |
| configuration files 350 |
360 |
| customizing for all users 351 |
360 |
| for all users 351 |
360 |
| location of 351 |
360 |
| master 350, 351 |
360 |
| configuring Adobe Fireworks 346 |
360 |
| Connector Line tool 87 |
360 |
| Constrain Proportions option 17 |
360 |
| constraining rotation 56 |
360 |
| context menus 37 |
360 |
| Contract command 49 |
360 |
| contracting paths 106 |
360 |
| contrast 76 |
360 |
| Convert to Symbol dialog box 186 |
360 |
| converting paths 104 |
360 |
| copying |
360 |
| all selected objects on a layer 161 |
360 |
| bitmaps 53 |
360 |
| frames 243 |
360 |
| HTML 283 |
360 |
| object attributes 186 |
360 |
| objects 53 |
360 |
| pixels 44 |
360 |
| copying and pasting |
360 |
| Adobe Fireworks HTML 283 |
360 |
| symbol instances 195 |
360 |
| copying and pasting objects from other applications 19 |
360 |
| corner points 94 |
360 |
| Create Symbol Script panel 28 |
360 |
| creating |
360 |
| master pages 157 |
360 |
| rich graphic symbols 190 |
360 |
| slideshows 250 |
360 |
| Crop command 105 |
360 |
| cropping |
360 |
| canvas 37 |
360 |
| documents 37 |
360 |
| CSS layers, exporting 285 |
360 |
| curve points 95 |
360 |
| curve segments, editing 96 |
360 |
| custom shortcut sets. See keyboard shortcuts |
360 |
| cutting paths 103 |
360 |
| D |
360 |
| darkening |
360 |
| bitmap areas 66 |
360 |
| images 68 |
360 |
| default preferences 348 |
360 |
| Delete Objects While Cropping preference 347 |
360 |
| Delete Paths When Converting to Marquee preference 347 |
360 |
| deleting |
360 |
| frames 244 |
360 |
| layers 160 |
360 |
| Live Filters 152 |
360 |
| masks 178 |
360 |
| pages 156 |
360 |
| points 99 |
360 |
| points on curves 75 |
360 |
| selected objects 54 |
360 |
| styles 185 |
360 |
| swatches 129 |
360 |
| Deselect command 47 |
360 |
| deselecting all objects 43 |
360 |
| Design Center 6 |
360 |
| Design Notes for Dreamweaver and Adobe Fireworks integration 303 |
360 |
| Director |
360 |
| cast members 319 |
360 |
| exporting to 317 |
360 |
| placing Adobe Fireworks files in 317 |
360 |
| disjoint rollovers 208 |
360 |
| applying to a slice 208 |
360 |
| attaching to hotspots 218 |
360 |
| creating 208 |
360 |
| display modes, switching 34 |
360 |
| Distort tool 57 |
360 |
| distorting objects 57 |
360 |
| dithering 267 |
360 |
| with websafe colors 132 |
360 |
| docking panels 28 |
360 |
| in panel group 29 |
360 |
| document tabs 31 |
360 |
| documents |
360 |
| creating new 15 |
360 |
| default mode 84 |
360 |
| multiple views 33 |
360 |
| opening 16 |
360 |
| recent 16 |
361 |
| saving 22 |
361 |
| switching 31 |
361 |
| tiling views 33 |
361 |
| Dodge tool 66 |
361 |
| Doughnut tool 87 |
361 |
| Down button state 221 |
361 |
| downloads |
361 |
| updates, plug-ins, and tryouts 7 |
361 |
| downsampling 36 |
361 |
| drag-and-drop behaviors |
361 |
| blue line 207 |
361 |
| definition 207 |
361 |
| deleting 208, 209 |
361 |
| dragging and dropping 18 |
361 |
| drawing 87 |
361 |
| arrows 86 |
361 |
| bending adjacent segments 99 |
361 |
| beveled rectangles 86 |
361 |
| chamfer rectangles 87 |
361 |
| changing adjacent segments 99 |
361 |
| connector lines 87 |
361 |
| converting straight paths to curved 97 |
361 |
| distorting objects 57 |
361 |
| doughnuts 87 |
361 |
| ellipses 84 |
361 |
| lines 84 |
361 |
| L-shapes 87 |
361 |
| pie charts 87 |
361 |
| polygons 85, 87 |
361 |
| rectangles 84 |
361 |
| rounded rectangles 85, 87 |
361 |
| selecting a point 98 |
361 |
| spirals 87 |
361 |
| splitting paths 104 |
361 |
| stars 85 |
361 |
| drawing area. See canvas |
361 |
| Dreamweaver |
361 |
| behaviors 206, 299 |
361 |
| editing Adobe Fireworks images in 297 |
361 |
| exporting to 288, 296 |
361 |
| files 292 |
361 |
| libraries 296 |
361 |
| making Adobe Fireworks the default image editor 302 |
361 |
| placeholders 292 |
361 |
| Dreamweaver and Adobe Fireworks integration |
361 |
| Design Notes 303 |
361 |
| editing Adobe Fireworks animations 301 |
361 |
| external editor preference 303 |
361 |
| Launch and Edit preferences 304 |
361 |
| launching and editing Adobe Fireworks images 298 |
361 |
| launching and editing Adobe Fireworks tables 299 |
361 |
| launching and optimizing Adobe Fireworks images 300 |
361 |
| Optimize Image in Adobe Fireworks command 300 |
361 |
| updating Adobe Fireworks HTML 296 |
361 |
| drop shadows 150 |
361 |
| duplicating |
361 |
| selected objects 53 |
361 |
| E |
361 |
| edges |
361 |
| beveled 149 |
361 |
| showing and hiding 43 |
361 |
| Edit Gradient dialog box 143 |
361 |
| Edit Stroke dialog box 138 |
361 |
| editing |
361 |
| actions in the History panel 345 |
361 |
| animation symbols 240 |
361 |
| behaviors 210 |
361 |
| bitmap objects 63 |
361 |
| gradient fills 142 |
361 |
| images 63 |
361 |
| Live Filters 152 |
361 |
| pages 156 |
361 |
| paths 100 |
361 |
| pixels 44 |
361 |
| pop-up menus 236 |
361 |
| selected objects 53 |
361 |
| single layer 162 |
361 |
| solid fills 141 |
361 |
| styles 185 |
361 |
| editing paths 107 |
361 |
| effects |
361 |
| editing 152 |
361 |
| finding and replacing 333 |
361 |
| glow 150 |
361 |
| Live Filters 147 |
361 |
| plug-ins 151 |
361 |
| removing 152 |
361 |
| setting defaults 153 |
361 |
| ellipse 84 |
361 |
| e-mail 289 |
361 |
| embossing 149 |
361 |
| EPS files, opening in Adobe Fireworks 17 |
361 |
| Eraser tool 65 |
361 |
| erasing bitmaps 65 |
361 |
| Expand command 49 |
361 |
| Expand Stroke command 106 |
361 |
| expanding |
361 |
| layers 161 |
361 |
| strokes 106 |
361 |
| Export Area tool 280 |
361 |
| Export Preview 258 |
361 |
| comparing optimization settings 259 |
361 |
| optimizing 258 |
361 |
| panning area 259 |
361 |
| previewing 258 |
361 |
| previewing optimization 258 |
361 |
| zooming 259 |
361 |
| exporting 276 |
361 |
| Adobe Fireworks files to Dreamweaver 321 |
361 |
| an area 280 |
361 |
| animated GIFs 248 |
361 |
| animations 247, 279 |
361 |
| batch process settings 337 |
361 |
| CSS layers 285 |
361 |
| customizing files for Photoshop 325 |
361 |
| default location for 276 |
361 |
| frames as multiple files 279 |
361 |
| hotspots 217 |
361 |
| HTML 280 |
361 |
| images 277 |
361 |
| layers as multiple files 279 |
361 |
| pages as image files 158 |
361 |
| pages to HTML 157 |
361 |
| results 281 |
361 |
| slices 211, 278 |
361 |
| styles 185 |
361 |
| symbols 195 |
361 |
| to Director 317 |
361 |
| to Dreamweaver 296 |
361 |
| to Flash 305, 310 |
361 |
| to FreeHand 314 |
361 |
| to Illustrator 314 |
361 |
| to Photoshop 325 |
361 |
| to WBMP files 265 |
361 |
| UTF-8 286 |
362 |
| XHTML 286 |
362 |
| exporting graphics 13 |
362 |
| Extension Manager 341 |
362 |
| external editor preference 303 |
362 |
| external files, converting to swap image 211 |
362 |
| Extras 5 |
362 |
| eyedropper pointer 130, 135, 136, 140 |
362 |
| Eyedropper tool 64, 128 |
362 |
| F |
362 |
| Feather command 65 |
362 |
| feathering 65 |
362 |
| creating feathered edges 144 |
362 |
| pixel selections 49 |
362 |
| features, new 8 |
362 |
| file formats |
362 |
| BMP 265 |
362 |
| GIF 265 |
362 |
| JPEG 265 |
362 |
| PNG 265 |
362 |
| TIFF 265 |
362 |
| File Management button 289, 304 |
362 |
| File Management menu 289, 304 |
362 |
| file size |
362 |
| reducing quality 273 |
362 |
| setting loss to reduce size 270 |
362 |
| filenames, changing in a batch process 339 |
362 |
| files, unlocking 289, 304 |
362 |
| Fill Color box 64 |
362 |
| Fill Color Live Filter 182 |
362 |
| fills |
362 |
| adding texture to 146 |
362 |
| adjusting 144 |
362 |
| applying color fills 76 |
362 |
| applying gradient 64, 142 |
362 |
| applying pattern 141 |
362 |
| applying solid 141 |
362 |
| changing color for basic shape tools 140 |
362 |
| changing edges 144 |
362 |
| drawing over strokes 139 |
362 |
| editing gradient 142 |
362 |
| editing solid 141 |
362 |
| feathering or anti-aliasing 144 |
362 |
| finding and replacing 333 |
362 |
| moving 144 |
362 |
| resetting default color 127 |
362 |
| rotating 144 |
362 |
| saving custom gradient 145 |
362 |
| saving gradient 145 |
362 |
| swapping stroke and fill colors 127 |
362 |
| transforming gradient 144 |
362 |
| transforming pattern 144 |
362 |
| transparency illusion 132 |
362 |
| web dither fill 132 |
362 |
| filters |
362 |
| Add Noise 83 |
362 |
| Blur 79 |
362 |
| Blur More 79 |
362 |
| Brightness/Contrast 76 |
362 |
| Find Edges 80 |
362 |
| Gaussian Blur 79 |
362 |
| Hue/Saturation 77 |
362 |
| Invert 78 |
362 |
| Motion Blur 79 |
362 |
| Photoshop plug-ins 150 |
362 |
| Radial Blur 80 |
362 |
| Sharpen 81 |
362 |
| Sharpen More 81 |
362 |
| Unsharp Mask 82 |
362 |
| Zoom Blur 80 |
362 |
| Find and Replace panel 331, 332 |
362 |
| Find Edges filter 80 |
362 |
| Find panel 28 |
362 |
| finding and replacing 331 |
362 |
| batch processed files 338 |
362 |
| colors 333 |
362 |
| fonts 332 |
362 |
| multiple files 332 |
362 |
| non-websafe colors 333 |
362 |
| selecting source for search 331 |
362 |
| text 332 |
362 |
| URLs 333 |
362 |
| uses 330 |
362 |
| Fireworks 327 |
362 |
| Fireworks. See Adobe Fireworks |
362 |
| Fit to Canvas 36 |
362 |
| Flash |
362 |
| exporting to 305, 310 |
362 |
| importing Adobe Fireworks PNG to 305 |
362 |
| Flash SWF movies 345 |
362 |
| Flatten Selection command 62 |
362 |
| Flex integration 329 |
362 |
| flipping objects 56 |
362 |
| floating pixel selections |
362 |
| creating 52 |
362 |
| moving 52 |
362 |
| font installation 2 |
362 |
| fonts |
362 |
| finding and replacing 332 |
362 |
| handling missing 123 |
362 |
| styles 112, 113 |
362 |
| type sizes 112, 113 |
362 |
| frame delay |
362 |
| animations 242 |
362 |
| frame delay, default setting 17 |
362 |
| frames |
362 |
| adding 243 |
362 |
| custom viewing 246 |
362 |
| deleting 244 |
362 |
| disabling layer sharing 245 |
362 |
| exporting 279 |
362 |
| inserting 243 |
362 |
| managing 242 |
362 |
| moving objects to another frame 244 |
362 |
| multiframe editing 246 |
362 |
| names in animation 243 |
362 |
| onion skinning 245 |
362 |
| reordering 244 |
362 |
| setting delay 242 |
362 |
| sharing layers for animation 244 |
362 |
| turning off onion skinning 246 |
362 |
| turning on and off 243 |
362 |
| viewing all 246 |
362 |
| viewing current and adjacent 246 |
362 |
| viewing next 246 |
362 |
| Frames panel 27, 242 |
362 |
| freeform paths 93 |
362 |
| FreeHand |
362 |
| exporting to 314 |
362 |
| placing Adobe Fireworks graphics in 312 |
362 |
| Full Screen with Menus mode 33 |
362 |
| G |
362 |
| Gaussian Blur filter 79 |
362 |
| GIF file format |
362 |
| choosing 265 |
362 |
| choosing a color palette 266 |
362 |
| swatches 128 |
362 |
| GIF, saving 23 |
362 |
| glow effects 150 |
362 |
| GoLive 288, 327 |
362 |
| gradient fills 64 |
363 |
| adding new color 143 |
363 |
| adjusting 144 |
363 |
| adjusting color transition 143 |
363 |
| applying 142 |
363 |
| changing colors 143 |
363 |
| converting images to transparency 81 |
363 |
| Edit Gradient dialog box 143 |
363 |
| editing 142 |
363 |
| moving 144 |
363 |
| removing colors from 143 |
363 |
| rotating 144 |
363 |
| saving custom 145 |
363 |
| transforming 144 |
363 |
| Grayscale color model 130 |
363 |
| grid |
363 |
| altering cell size 40 |
363 |
| changing default color 39 |
363 |
| showing/hiding 39 |
363 |
| snapping objects to 39 |
363 |
| grouping objects 58 |
363 |
| guides 38 |
363 |
| locking 39 |
363 |
| snapping objects to 39 |
363 |
| H |
363 |
| halos, removing 275 |
363 |
| handles, transform 54 |
363 |
| Help 2 |
363 |
| Hexadecimal color model 130 |
363 |
| Hide All command 170 |
363 |
| Hide Panels command 29 |
363 |
| Hide Selection command 170 |
363 |
| hiding |
363 |
| edges 43 |
363 |
| layers 162 |
363 |
| objects on layers 162 |
363 |
| panels 29 |
363 |
| toolbars 31 |
363 |
| highlights 72 |
363 |
| Histogram 72 |
363 |
| History panel 27, 40 |
363 |
| changing the number of steps in 343 |
363 |
| clearing all steps from 343 |
363 |
| editing actions with 345 |
363 |
| replaying steps 343 |
363 |
| HomeSite |
363 |
| placing Adobe Fireworks HTML in 320 |
363 |
| placing Adobe Fireworks images in 320 |
363 |
| hotspots 13 |
363 |
| applying drag-and-drop rollovers 218 |
363 |
| assigning URLs 212 |
363 |
| creating 216 |
363 |
| editing shape 217 |
363 |
| irregular 217 |
363 |
| on top of slices 219 |
363 |
| HSB color model 130 |
363 |
| HTML 281 |
363 |
| copying and pasting from Adobe Fireworks to Dreamweaver 283 |
363 |
| exporting 280, 282 |
363 |
| inserting from Adobe Fireworks into Dreamweaver 295 |
363 |
| replacing older version 285 |
363 |
| Roundtrip 298 |
363 |
| Setup 287 |
363 |
| updating Adobe Fireworks HTML placed in Dreamweaver 296 |
363 |
| working with editors 327 |
363 |
| HTML, opening tables 18 |
363 |
| hue, adjusting 71, 77 |
363 |
| Hue/Saturation filter 77 |
363 |
| I |
363 |
| icon images. See thumbnails |
363 |
| Illustrator |
363 |
| exporting to 314 |
363 |
| importing files into Adobe Fireworks 326 |
363 |
| Image Editing panel 28, 63 |
363 |
| image maps 216 |
363 |
| creating 216 |
363 |
| exporting 218 |
363 |
| images |
363 |
| exporting 277 |
363 |
| Image Editing panel 63 |
363 |
| painting 63 |
363 |
| saving 277 |
363 |
| selecting 44 |
363 |
| selecting pixels 44 |
363 |
| images as fills. See Paste Inside command |
363 |
| import text 122 |
363 |
| ASCII text 123 |
363 |
| Photoshop files 123, 323 |
363 |
| RTF files 123 |
363 |
| importing |
363 |
| from digital camera 20 |
363 |
| Photoshop files 323 |
363 |
| Photoshop import preferences 348 |
363 |
| PNG files 20 |
363 |
| styles 185 |
363 |
| symbols 195 |
363 |
| indenting text 117 |
363 |
| Info panel 28 |
363 |
| inserting |
363 |
| Adobe Fireworks HTML into Dreamweaver 295 |
363 |
| Adobe Fireworks images into Dreamweaver 292 |
363 |
| Inset Path command 106 |
363 |
| installing Photoshop plug-ins 151 |
363 |
| instance-level properties 225 |
363 |
| instances |
363 |
| defined 186 |
363 |
| editing 193 |
363 |
| placing in document 187 |
363 |
| tweening 246 |
363 |
| integration with other applications 291 |
363 |
| interactive button properties 226 |
363 |
| interactivity 13 |
363 |
| interlacing graphics 272 |
363 |
| interpolation (scaling) 346 |
363 |
| Intersect command 105 |
363 |
| Invert filter 78 |
363 |
| italic text 112 |
363 |
| J |
363 |
| JPEG files |
363 |
| choosing JPEG format 265 |
363 |
| editing selected areas 274 |
363 |
| optimization settings 272 |
363 |
| progressive 274 |
363 |
| Selective JPEG compression 273 |
363 |
| Sharpen JPEG Edges command 274 |
363 |
| JPEG, saving 23 |
363 |
| K |
363 |
| kerning 114 |
363 |
| keyboard shortcuts 349 |
363 |
| changing current set 349 |
363 |
| custom shortcut sets 349 |
363 |
| deleting custom shortcut sets 350 |
363 |
| reference sheet for current set 350 |
364 |
| secondary shortcuts 349 |
364 |
| UTF-8 encoded reference sheets 350 |
364 |
| keyboard shortcuts in Help 3 |
364 |
| Knife tool 103 |
364 |
| L |
364 |
| Launch and Edit preferences 304 |
364 |
| Launch options 347 |
364 |
| layer effects, Photoshop 151 |
364 |
| layers |
364 |
| activating 159 |
364 |
| adding and removing 160 |
364 |
| disabling sharing across frames 245 |
364 |
| duplicating 160 |
364 |
| expanding or collapsing 161 |
364 |
| exporting 279 |
364 |
| locking 162 |
364 |
| moving 161 |
364 |
| naming 161 |
364 |
| organizing 161 |
364 |
| removing from master pages 157 |
364 |
| sharing 163 |
364 |
| sharing across frames for animation 244 |
364 |
| viewing 161 |
364 |
| Layers panel 27, 159 |
364 |
| naming slices 213 |
364 |
| viewing slices 203 |
364 |
| leading 115 |
364 |
| letter spacing. See kerning |
364 |
| Levels feature for adjusting tonal range 72 |
364 |
| Library panel 186 |
364 |
| inserting button symbols 223 |
364 |
| lightening |
364 |
| bitmap areas 66 |
364 |
| images 68 |
364 |
| line spacing 115 |
364 |
| See also leading |
364 |
| lines 84 |
364 |
| See also strokes |
364 |
| linking to master pages 157 |
364 |
| Live Filters |
364 |
| applying 153 |
364 |
| applying to objects 148 |
364 |
| creating 152 |
364 |
| editing 152 |
364 |
| enabling or disabling 148 |
364 |
| Fill Color 182 |
364 |
| in buttons 222 |
364 |
| Photoshop plug-ins 150 |
364 |
| removing 152 |
364 |
| renaming 153 |
364 |
| reordering 152 |
364 |
| LiveDocs 2 |
364 |
| locked files 289, 304 |
364 |
| locking layers 162 |
364 |
| L-shape tool 87 |
364 |
| M |
364 |
| macros 343 |
364 |
| marquees 44 |
364 |
| adjusting 47 |
364 |
| contracting 49 |
364 |
| deleting 52 |
364 |
| deselecting 47 |
364 |
| expanding 49 |
364 |
| moving 47 |
364 |
| removing 47 |
364 |
| saving and restoring 51 |
364 |
| selecting area around 50 |
364 |
| selecting pixels by intersecting 48 |
364 |
| smoothing 50 |
364 |
| transferring to another object 50 |
364 |
| masks 164 |
364 |
| adding objects to a masked selection 178 |
364 |
| bitmap 165 |
364 |
| creating empty 170 |
364 |
| deleting 178 |
364 |
| disabling 178 |
364 |
| enabling 178 |
364 |
| grouping objects to form a mask 172 |
364 |
| modifying 175 |
364 |
| moving with masked objects 174 |
364 |
| replacing 178 |
364 |
| text as a mask 169 |
364 |
| using an existing object as 167, 169 |
364 |
| vector 164 |
364 |
| master pages |
364 |
| changing to normal page 157 |
364 |
| creating 157 |
364 |
| linking to 157 |
364 |
| removing layers 157 |
364 |
| merging paths 99, 103 |
364 |
| midtones 72 |
364 |
| mirroring. See flipping objects |
364 |
| mobile phone graphics 17 |
364 |
| mobile phone graphics. See WBMP files |
364 |
| modes |
364 |
| entering bitmap 12 |
364 |
| entering vector 12 |
364 |
| vector 84 |
364 |
| Motion Blur filter 79 |
364 |
| mouse events 210 |
364 |
| Mouse Highlight preference 347 |
364 |
| MXML export 329 |
364 |
| N |
364 |
| nav (navigation) bars |
364 |
| creating 228 |
364 |
| Down state 210 |
364 |
| Over state 210 |
364 |
| Restore behavior 210 |
364 |
| navigating a document 31 |
364 |
| navigation shortcuts 3 |
364 |
| nearest neighbor interpolation scaling method 347 |
364 |
| nested tables 215 |
364 |
| new document, matching Clipboard size 15 |
364 |
| new features 8 |
364 |
| Numeric Transform command 57 |
364 |
| O |
364 |
| object-oriented graphics 14 |
364 |
| objects |
364 |
| converting to animation 239 |
364 |
| creating bitmaps 62 |
364 |
| distorting 57 |
364 |
| grouping 58 |
364 |
| merging 162 |
364 |
| moving selected 53 |
364 |
| removing an effect 152 |
364 |
| selecting 41 |
364 |
| selecting alpha channel 48 |
364 |
| skewing 56 |
364 |
| slanting 56 |
364 |
| stacking 59 |
364 |
| ungrouping 58 |
364 |
| objects, locating pasted 19 |
364 |
| onion skinning |
364 |
| Button Editor 220 |
364 |
| custom viewing 246 |
364 |
| defined 245 |
365 |
| multiframe editing 246 |
365 |
| turning off 246 |
365 |
| viewing all frames 246 |
365 |
| viewing current and adjacent frames 246 |
365 |
| viewing next frame 246 |
365 |
| opacity, adjusting 181, 271 |
365 |
| See also transparency |
365 |
| opening |
365 |
| animated GIFs 17, 248 |
365 |
| documents 16 |
365 |
| graphics created in other applications 16 |
365 |
| multiple document views 33 |
365 |
| multiple files as animations 249 |
365 |
| PSD files 17 |
365 |
| recent files 16 |
365 |
| WBMP files 17 |
365 |
| optimization settings |
365 |
| changing in a batch process 337 |
365 |
| comparing two or four settings 264 |
365 |
| deleting preset settings 276 |
365 |
| JPEG 272 |
365 |
| preset 213, 262 |
365 |
| reusing 263, 275 |
365 |
| saving 263, 275 |
365 |
| sharing with another user 276 |
365 |
| Optimize Image in Adobe Fireworks command 300 |
365 |
| Optimize panel 27 |
365 |
| Optimize to Size wizard 260 |
365 |
| optimizing 258 |
365 |
| Adobe Fireworks images from Dreamweaver 300 |
365 |
| animations 248 |
365 |
| basics 257 |
365 |
| using Export Wizard 258 |
365 |
| optimizing graphics 13 |
365 |
| Options menu in panels 30 |
365 |
| outlines 136 |
365 |
| See also strokes |
365 |
| Over button state 221 |
365 |
| Over While Down button state 221 |
365 |
| overlapping slices 205 |
365 |
| P |
365 |
| package contents, viewing 352 |
365 |
| pages |
365 |
| adding and removing 156 |
365 |
| creating links between 197 |
365 |
| duplicating 156 |
365 |
| editing 156 |
365 |
| exporting as image files 158 |
365 |
| exporting to HTML 157 |
365 |
| master 157 |
365 |
| moving between 156 |
365 |
| Pages panel 27 |
365 |
| panels 27 |
365 |
| Align 28 |
365 |
| Auto Shapes Properties 28 |
365 |
| Behaviors 28, 209 |
365 |
| Create Symbol Script 28 |
365 |
| docking 28 |
365 |
| docking in panel group 29 |
365 |
| Find 28 |
365 |
| Find and Replace 331, 332 |
365 |
| Frames 27, 242 |
365 |
| hiding 29 |
365 |
| History 27, 40 |
365 |
| Image Editing 28 |
365 |
| Info 28 |
365 |
| Layer 159 |
365 |
| Layers 27 |
365 |
| Library 186 |
365 |
| moving 28 |
365 |
| opening custom layouts 30 |
365 |
| Optimize 27 |
365 |
| Options menu in 30 |
365 |
| organizing 28 |
365 |
| Pages 27 |
365 |
| restoring default positions 29 |
365 |
| saving custom layouts 30 |
365 |
| Shapes 27 |
365 |
| Special Characters 28 |
365 |
| Styles 27, 183 |
365 |
| Swatches 28, 127 |
365 |
| Symbol Properties 28 |
365 |
| Tools 25 |
365 |
| undocking 28 |
365 |
| undocking from panel group 28 |
365 |
| URL 27, 196 |
365 |
| using SWF movies as 345 |
365 |
| panning 33 |
365 |
| paragraph spacing 117 |
365 |
| Paste Inside command 168 |
365 |
| pasted images 19 |
365 |
| pasting HTML 284 |
365 |
| Path panel 107 |
365 |
| paths 103 |
365 |
| adding stroke texture 145 |
365 |
| bending adjacent segments 99 |
365 |
| changing adjacent segments 99 |
365 |
| changing shape 99 |
365 |
| converting straight to curved 97 |
365 |
| copying and pasting 315 |
365 |
| creating custom strokes 138 |
365 |
| cropping 105 |
365 |
| editing strokes 136 |
365 |
| pulling 101 |
365 |
| pushing 101 |
365 |
| resetting default colors 127 |
365 |
| selecting a point 98 |
365 |
| splitting 104 |
365 |
| swapping stroke and fill colors 127 |
365 |
| pattern fills |
365 |
| adjusting 144 |
365 |
| applying 141 |
365 |
| moving 144 |
365 |
| rotating 144 |
365 |
| transforming 144 |
365 |
| Pen tool 94 |
365 |
| adding points with 99 |
365 |
| curved segments 95 |
365 |
| deleting points with 99 |
365 |
| resuming path 99 |
365 |
| straight segments 94 |
365 |
| Pencil tool 63 |
365 |
| perspective illusion 57 |
365 |
| Photoshop |
365 |
| applying layer effects 151 |
365 |
| applying plug-ins 151 |
365 |
| customizing files for export 325 |
365 |
| exporting to 325 |
365 |
| grouped layers 164 |
365 |
| import preferences 348 |
365 |
| importing files into Adobe Fireworks 322 |
365 |
| installing plug-ins 151 |
365 |
| layer masks 171 |
365 |
| patterns 348 |
365 |
| plug-ins 324, 348 |
365 |
| textures 348 |
365 |
| Photoshop Acquire installation plug- ins 20 |
365 |
| Photoshop and Adobe Fireworks |
365 |
| exporting PSD files from Adobe Fireworks 325 |
365 |
| importing PSD files into Adobe Fireworks 323 |
366 |
| Pick Distance preference 347 |
366 |
| PICT file format 265 |
366 |
| pie chart 87 |
366 |
| Pie tool 87 |
366 |
| pixels 14 |
366 |
| adjusting tonal range using eyedropper 75 |
366 |
| cloning 66 |
366 |
| contracting selection border 49 |
366 |
| copying 44 |
366 |
| cutting 44 |
366 |
| expanding selection border 49 |
366 |
| feathering 65 |
366 |
| moving 44 |
366 |
| painting 63 |
366 |
| selecting 44 |
366 |
| selecting area around a marquee 50 |
366 |
| selecting freeform area 45 |
366 |
| selecting polygonal area 45 |
366 |
| selecting similar colors 46 |
366 |
| smoothing a marquee border 50 |
366 |
| tonal range 72 |
366 |
| playing |
366 |
| animations 246 |
366 |
| macros 343 |
366 |
| saved commands 343 |
366 |
| plotting points 94 |
366 |
| plug-ins 5, 324 |
366 |
| in Adobe Store 7 |
366 |
| PNG file format |
366 |
| choosing 265 |
366 |
| choosing a color palette 266 |
366 |
| transparency 311 |
366 |
| point handles 96 |
366 |
| displaying 98 |
366 |
| Pointer tool 41, 44 |
366 |
| points |
366 |
| adding 99 |
366 |
| bending adjacent segments 99 |
366 |
| changing adjacent segments 99 |
366 |
| converting 97 |
366 |
| converting straight to curved 97 |
366 |
| deleting 99 |
366 |
| moving 98 |
366 |
| selecting 98 |
366 |
| polygons 85, 87 |
366 |
| pop-up menus 229 |
366 |
| advanced properties 234 |
366 |
| description 229 |
366 |
| designing appearance 232 |
366 |
| editing 236 |
366 |
| entering menu text 230, 231 |
366 |
| exporting 237 |
366 |
| setting position 235 |
366 |
| Precise Cursors preference 347 |
366 |
| preferences 346 |
366 |
| color defaults 346 |
366 |
| default 348 |
366 |
| editing options 347 |
366 |
| Faster but less accurate sampling options 347 |
366 |
| folder options 348 |
366 |
| Import 323 |
366 |
| import options 348 |
366 |
| interpolation options 346 |
366 |
| Launch and Edit 304 |
366 |
| launch and edit options 347 |
366 |
| Launch options 347 |
366 |
| location of file 351 |
366 |
| restoring defaults 348 |
366 |
| setting 346 |
366 |
| Undo Steps 346 |
366 |
| Preview button 263 |
366 |
| Preview Drag preference 347 |
366 |
| previewing |
366 |
| documents in a browser 288 |
366 |
| optimization settings 263, 264 |
366 |
| pixels containing specific color 269 |
366 |
| strokes 138 |
366 |
| with Export Preview 258 |
366 |
| previewing documents on different platforms 34 |
366 |
| progressive JPEGs 274 |
366 |
| properties, viewing in Property inspector 26 |
366 |
| Property inspector 26, 43 |
366 |
| collapsing 27 |
366 |
| docking 26 |
366 |
| expanding 26 |
366 |
| masking with 176 |
366 |
| reducing 26 |
366 |
| selection information 42 |
366 |
| undocking 26 |
366 |
| working with text in 109 |
366 |
| PSD files 17 |
366 |
| opening from Adobe Fireworks 17 |
366 |
| Punch command 105 |
366 |
| Q |
366 |
| Quick Export button 31, 288 |
366 |
| Quick Export pop-up menu 289 |
366 |
| R |
366 |
| Radial Blur filter 80 |
366 |
| raster images 61 |
366 |
| read me file 2 |
366 |
| rectangles 84 |
366 |
| rounded corners 89 |
366 |
| Red-eye Removal tool 66, 69 |
366 |
| redoing using History panel 343 |
366 |
| Redraw Path tool 102 |
366 |
| redrawing paths 102 |
366 |
| reducing points 105 |
366 |
| registration of software 1 |
366 |
| reinstalling Adobe Fireworks 352 |
366 |
| relative URLs, entering 196 |
366 |
| removing |
366 |
| effects 152 |
366 |
| master page layers 157 |
366 |
| parts of a path 105 |
366 |
| renaming symbols 188 |
366 |
| repeating actions 40 |
366 |
| Replace color tool 66, 69, 70 |
366 |
| replacing elements 330 |
366 |
| replaying animations 246 |
366 |
| resampling 19 |
366 |
| bitmap objects 36 |
366 |
| described 36 |
366 |
| downsampling 36 |
366 |
| resampling up 36 |
366 |
| speed 347 |
366 |
| vector objects 36 |
366 |
| reshaping vector objects 102 |
366 |
| Reveal All command 170 |
366 |
| Reveal Selection command 170 |
366 |
| RGB color model 130 |
366 |
| rich graphic symbols 190 |
366 |
| creating 190 |
366 |
| viewing 190 |
366 |
| rollovers 13 |
366 |
| active area 226 |
366 |
| converting to buttons 223 |
366 |
| creating 220 |
366 |
| defined 206 |
366 |
| navigation bars 228 |
366 |
| odd-shaped 202 |
366 |
| simple 209 |
366 |
| Simple Rollover behavior 209 |
367 |
| swap image 207 |
367 |
| rotating |
367 |
| constraining 56 |
367 |
| objects 55 |
367 |
| relocating axis of rotation 56 |
367 |
| Rounded Rectangle tool 87, 89 |
367 |
| rounded rectangles 85 |
367 |
| Rubber Stamp tool 66 |
367 |
| rulers 38 |
367 |
| S |
367 |
| saturation, adjusting 71 |
367 |
| saving 276 |
367 |
| animations 279 |
367 |
| images 277 |
367 |
| saving documents 22, 23 |
367 |
| Scale tool 55 |
367 |
| scaling |
367 |
| graphics 338 |
367 |
| interpolation options 346 |
367 |
| objects 55 |
367 |
| scripting 343 |
367 |
| editing scripts 344 |
367 |
| Flash SWF files 344 |
367 |
| scrolling the canvas 33 |
367 |
| See also panning |
367 |
| searching 330 |
367 |
| See also finding and replacing |
367 |
| segments, converting 97 |
367 |
| selecting |
367 |
| adding to a pixel selection 47, 48 |
367 |
| additional objects 43 |
367 |
| alpha area 48 |
367 |
| area around a marquee 50 |
367 |
| canceling a selection 54 |
367 |
| contracting a marquee border 49 |
367 |
| deselecting a marquee 47 |
367 |
| deselecting an object 43 |
367 |
| expanding a marquee border 49 |
367 |
| feathering a pixel selection 49 |
367 |
| feathering edges 65 |
367 |
| floating pixel selection 52 |
367 |
| freeform area of pixels 45 |
367 |
| grouped objects 58 |
367 |
| images 44 |
367 |
| inverting a pixel selection 49 |
367 |
| overlapping areas of bitmaps 48 |
367 |
| pixel areas 45 |
367 |
| pixels 44 |
367 |
| points 98 |
367 |
| polygonal area of pixels 45 |
367 |
| similar colors 46 |
367 |
| smoothing a marquee border 50 |
367 |
| subtracting from a pixel selection 47, 48 |
367 |
| Selective JPEG compression 273 |
367 |
| Enable Selective Quality 273 |
367 |
| overlay color 273 |
367 |
| preserve button quality 274 |
367 |
| preserve text quality 274 |
367 |
| Selective Quality button 273 |
367 |
| Send Backward command 59 |
367 |
| Send to Back command 59 |
367 |
| sending documents as e-mail attachments 289 |
367 |
| Set Nav Bar Image behavior 210 |
367 |
| Set Pop-up Menu behavior 210 |
367 |
| Set Text of Status Bar behavior 210 |
367 |
| shadows 72, 150 |
367 |
| shapes 14 |
367 |
| Shapes panel 27 |
367 |
| sharing layers 163 |
367 |
| Sharpen filter 81 |
367 |
| Sharpen More filter 81 |
367 |
| Sharpen tool 66 |
367 |
| sharpening 81 |
367 |
| bitmap areas 66 |
367 |
| images 67 |
367 |
| shortcut sets 350 |
367 |
| See also keyboard shortcuts |
367 |
| Show Fill Handles preference 347 |
367 |
| Show Pen Preview preference 347 |
367 |
| Show Solid Points preference 347 |
367 |
| Show/Hide hotspots and slices 203 |
367 |
| showing |
367 |
| edges 43 |
367 |
| panels 29 |
367 |
| rulers 38 |
367 |
| toolbars 31 |
367 |
| Simple Rollover behavior 209 |
367 |
| simple rollovers 207 |
367 |
| creating 209 |
367 |
| Simplify command 106 |
367 |
| simplifying paths 105 |
367 |
| Skew tool 56 |
367 |
| skewing objects 56 |
367 |
| slanting objects 56 |
367 |
| slice guides |
367 |
| changing color 203 |
367 |
| removing 205 |
367 |
| viewing 203 |
367 |
| slices 13 |
367 |
| auto-naming 213 |
367 |
| changing color 203 |
367 |
| creating 201 |
367 |
| editing Adobe Fireworks table slices from Dreamweaver 299 |
367 |
| exporting 277, 278 |
367 |
| overlapping 205 |
367 |
| polygon 202 |
367 |
| resizing 204 |
367 |
| showing or hiding slice overlay 264 |
367 |
| text 201 |
367 |
| updating 278 |
367 |
| using nested tables 215 |
367 |
| using spacer 215 |
367 |
| slicing |
367 |
| definition 200 |
367 |
| for interactivity 200 |
367 |
| slideshow properties 252 |
367 |
| slideshows, creating 250 |
367 |
| Smart Polygon tool 87 |
367 |
| Smooth command 50 |
367 |
| Smudge tool 66 |
367 |
| smudging |
367 |
| bitmap areas 66 |
367 |
| images 68 |
367 |
| Snap Distance preference 347 |
367 |
| soft interpolation scaling method 346 |
367 |
| software |
367 |
| activation 1 |
367 |
| registration 1 |
367 |
| software downloads 7 |
367 |
| solid fills |
367 |
| adding texture to 146 |
367 |
| applying 141 |
367 |
| spacers 215 |
367 |
| Special Characters panel 28 |
367 |
| spell checking 124 |
367 |
| Spiral tool 87 |
367 |
| Split command 104 |
367 |
| stacking objects 59 |
367 |
| Standard Screen mode 33 |
367 |
| Star tool 87 |
367 |
| stars 85, 87 |
367 |
| Start page 24 |
367 |
| straight segments, editing 95 |
368 |
| Stroke Color box 136 |
368 |
| strokes 136 |
368 |
| adding texture 145 |
368 |
| changing centering 139 |
368 |
| changing color of drawing tools 137 |
368 |
| choosing 136 |
368 |
| creating custom 138 |
368 |
| drawing fill over 139 |
368 |
| edges of 136 |
368 |
| editing 136 |
368 |
| finding and replacing 333 |
368 |
| reorienting 139 |
368 |
| resetting default color 127 |
368 |
| saving settings 140 |
368 |
| setting sensitivity 139 |
368 |
| swapping stroke and fill colors 127 |
368 |
| textures 136 |
368 |
| styles |
368 |
| adding 184 |
368 |
| applying 184 |
368 |
| basing on existing styles 185 |
368 |
| defined 183 |
368 |
| deleting 185 |
368 |
| editing 185 |
368 |
| enlarging preview icons 186 |
368 |
| exporting 185 |
368 |
| importing 185 |
368 |
| new 184 |
368 |
| resetting to defaults 186 |
368 |
| Styles panel 27, 183 |
368 |
| Subselection tool |
368 |
| auto-joining paths with 100 |
368 |
| selecting masks with 173 |
368 |
| swap color palettes 134 |
368 |
| Swap Image behavior 209 |
368 |
| swap image rollovers |
368 |
| creating disjoint rollovers 208 |
368 |
| with single slice 207 |
368 |
| swap image, external images for 211 |
368 |
| swatch group, choosing custom 128 |
368 |
| Swatches panel 28, 127 |
368 |
| appending swatches 128 |
368 |
| deleting a color 129 |
368 |
| replacing a color 129 |
368 |
| saving custom 129 |
368 |
| Windows system colors 128 |
368 |
| swatches, choosing custom 128 |
368 |
| SWF movies 345 |
368 |
| symbol library 186 |
368 |
| Symbol Properties panel 28 |
368 |
| symbols |
368 |
| breaking a link 193 |
368 |
| creating 186 |
368 |
| defined 186 |
368 |
| deleting 188 |
368 |
| duplicating 188 |
368 |
| editing 187, 193 |
368 |
| editing graphics 241 |
368 |
| exporting 195 |
368 |
| importing 195 |
368 |
| modifying 187 |
368 |
| placing instances 187 |
368 |
| placing instances in document 187 |
368 |
| rich graphic 190 |
368 |
| saving as rich graphic symbols 191 |
368 |
| swapping 188 |
368 |
| tweening 246 |
368 |
| using 9-slice scaling 188 |
368 |
| system color picker 131 |
368 |
| system requirements 1 |
368 |
| T |
368 |
| text |
368 |
| adjusting character width 118 |
368 |
| alignment 116 |
368 |
| attributes, saving 119 |
368 |
| checking spelling 124 |
368 |
| color 113 |
368 |
| direction of 116 |
368 |
| entering 109 |
368 |
| finding and replacing 332 |
368 |
| formatting 112 |
368 |
| indenting 117 |
368 |
| orientation 116 |
368 |
| overview 109 |
368 |
| paragraph spacing 117 |
368 |
| slices 201 |
368 |
| Text Editor 125 |
368 |
| text blocks |
368 |
| auto-sizing 111 |
368 |
| fixed-width 111 |
368 |
| moving 111 |
368 |
| naming 110 |
368 |
| resizing 111 |
368 |
| text paths |
368 |
| attaching text to path 120 |
368 |
| changing shape of path 120 |
368 |
| converting text to path 122 |
368 |
| detaching from path 120 |
368 |
| editing text attached to a path 120 |
368 |
| moving starting point of text 121 |
368 |
| placing text on a path 121 |
368 |
| text styles |
368 |
| bold 113 |
368 |
| effects 119 |
368 |
| fills 119 |
368 |
| italic 113 |
368 |
| strokes 119 |
368 |
| underline 113 |
368 |
| Text tool 109 |
368 |
| texture |
368 |
| adding to fills 146 |
368 |
| adding to strokes 145 |
368 |
| thumbnails |
368 |
| in Layers panel 159 |
368 |
| selecting masks with 173 |
368 |
| TIFF file format, choosing 265 |
368 |
| TIFF, saving 23 |
368 |
| tonal range 72 |
368 |
| adjusting with Curves 74 |
368 |
| adjusting with Levels 72 |
368 |
| tone, adjusting 71 |
368 |
| toolbars |
368 |
| docking 31 |
368 |
| showing and hiding 31 |
368 |
| undocking 31 |
368 |
| unlocking 31 |
368 |
| tools |
368 |
| Blur 66 |
368 |
| Brush 64 |
368 |
| Burn 66 |
368 |
| changing options 25 |
368 |
| changing stroke color 137 |
368 |
| Colors section in Tools panel 126 |
368 |
| Distort 57 |
368 |
| Dodge 66 |
368 |
| Eraser 65 |
368 |
| Eyedropper 64 |
368 |
| Lasso 44 |
368 |
| Magic Wand 44 |
368 |
| Marquee 44 |
368 |
| Oval Marquee 44 |
368 |
| Pencil 63 |
368 |
| Pointer 41, 44 |
368 |
| Polygon Lasso 44 |
368 |
| Red-eye Removal 66, 69 |
369 |
| Replace Color 66, 69, 70 |
369 |
| Rubber Stamp 66 |
369 |
| Scale 55 |
369 |
| Sharpen 66 |
369 |
| Skew 56 |
369 |
| Smudge 66 |
369 |
| Subselection 100, 173 |
369 |
| Text 109 |
369 |
| tool group pop-up menus 26 |
369 |
| Transform 54 |
369 |
| Zoom 32 |
369 |
| Tools panel 25 |
369 |
| transformation tools |
369 |
| Distort 57 |
369 |
| Scale 55 |
369 |
| Skew 56 |
369 |
| transforming |
369 |
| by dragging 54 |
369 |
| gradient fills 144 |
369 |
| numerically 57 |
369 |
| objects 54 |
369 |
| pattern fills 144 |
369 |
| text 122 |
369 |
| transparency 181, 271 |
369 |
| adding or removing colors 272 |
369 |
| animation 247 |
369 |
| converting images to gradient transparency 81 |
369 |
| illusion 132 |
369 |
| in PNG files 311 |
369 |
| selecting a color 271, 272 |
369 |
| See also opacity |
369 |
| transparent areas 271 |
369 |
| trimming the canvas 36 |
369 |
| tryouts 7 |
369 |
| Turn off Hide Edges preference 347 |
369 |
| Tween Instances command 246 |
369 |
| tweening |
369 |
| characteristics 246 |
369 |
| defined 246 |
369 |
| objects 246 |
369 |
| typefaces. See fonts |
369 |
| U |
369 |
| underlined text 112 |
369 |
| undocking panels from panel group 28 |
369 |
| undoing 40 |
369 |
| setting number of undo steps 346 |
369 |
| using History panel 343 |
369 |
| ungrouping objects 58 |
369 |
| uninstalling Adobe Fireworks 352 |
369 |
| Union command 104 |
369 |
| Unsharp Mask filter 82 |
369 |
| Up button state 221 |
369 |
| Update HTML command 285, 296 |
369 |
| updates 7 |
369 |
| updating slices 278 |
369 |
| URL library 196 |
369 |
| adding URLs 197 |
369 |
| adding used URLs 198 |
369 |
| creating 197 |
369 |
| entering absolute or relative URLs 196 |
369 |
| URL panel 27, 196 |
369 |
| URLs |
369 |
| assigning to a web object 198 |
369 |
| assigning to buttons or instances 226 |
369 |
| finding and replacing 333 |
369 |
| selecting target options 212 |
369 |
| user configuration files 350, 351 |
369 |
| user folder 350, 351 |
369 |
| UTF-8 encoding 286, 350 |
369 |
| V |
369 |
| valid files, defined 335 |
369 |
| vector graphics 14 |
369 |
| vector masks 164 |
369 |
| converting to bitmap mask 177 |
369 |
| creating 166 |
369 |
| using an existing object as 167, 169 |
369 |
| vector mode 12 |
369 |
| drawing in 84 |
369 |
| switching to 61 |
369 |
| vector objects, reshaping 100 |
369 |
| Video Workshop 4 |
369 |
| view modes 33 |
369 |
| viewing rich graphic symbols 190 |
369 |
| W |
369 |
| WAP graphics 17 |
369 |
| See also WBMP files |
369 |
| WBMP files 17 |
369 |
| exporting to 265 |
369 |
| opening from Adobe Fireworks 17 |
369 |
| saving 23 |
369 |
| Web Layer 163 |
369 |
| web safe colors 133 |
369 |
| websafe colors 270 |
369 |
| When Editing From External Application preference 348 |
369 |
| When Optimizing From External Application preference 348 |
369 |
| Windows system colors as a swatch group 128 |
369 |
| work environment 24 |
369 |
| workflow in Adobe Fireworks 12 |
369 |
| X |
369 |
| XHTML 286 |
369 |
| Z |
369 |
| Zoom Blur filter 80 |
369 |
| Zoom tool 32 |
369 |
| zooming 31 |
369 |
| into a specific area 32 |
369 |

 1
1 72
72 73
73 74
74 75
75 76
76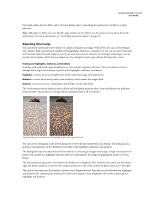 77
77 78
78 79
79 80
80 81
81 82
82

