Cisco VG204 Software Configuration Guide - Page 47
Error Reporting, Debug Commands
 |
View all Cisco VG204 manuals
Add to My Manuals
Save this manual to your list of manuals |
Page 47 highlights
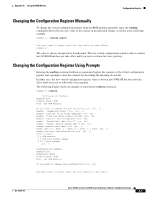
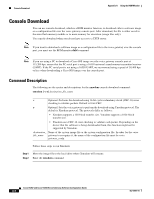
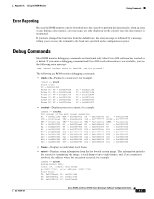
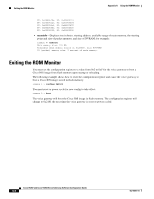
Appendix A Using the ROM Monitor Debug Commands Error Reporting Because the ROM monitor console download uses the console to perform the data transfer, when an error occurs during a data transfer, error messages are only displayed on the console once the data transfer is terminated. If you have changed the baud rate from the default rate, the error message is followed by a message telling you to restore the terminal to the baud rate specified in the configuration register. Debug Commands Most ROM monitor debugging commands are functional only when Cisco IOS software has crashed or is halted. If you enter a debugging command and Cisco IOS crash information is not available, you see the following error message: "xxx: kernel context state is invalid, can not proceed." The following are ROM monitor debugging commands: • stack or k-Produces a stack trace; for example: rommon 6> stack Stack trace: PC = 0x801111b0 Frame 00: FP = 0x80005ea8 Frame 01: FP = 0x80005eb4 Frame 02: FP = 0x80005f74 Frame 03: FP = 0x80005f9c Frame 04: FP = 0x80005fac Frame 05: FP = 0x80005fc4 PC = 0x801111b0 PC = 0x80113694 PC = 0x8010eb44 PC = 0x80008118 PC = 0x80008064 PC = 0xfff03d70 • context-Displays processor context; for example: rommon 7> context CPU context of the most recent exception: PC = 0x801111b0 MSR = 0x00009032 CR = 0x53000035 CTR = 0x801065e4 XER = 0xa0006d36 DAR = 0xffffffff DEC = 0xffffffff TBU = 0xffffffff TBL = 0xffffffff R0 = 0x00000000 R1 = 0x80005ea8 R2 = 0xffffffff R4 = 0x8fab0d76 R5 = 0x80657d00 R6 = 0x80570000 R8 = 0x00000000 R9 = 0x80570000 R10 = 0x0000954c R12 = 0x00000080 R13 = 0xffffffff R14 = 0xffffffff R16 = 0xffffffff R17 = 0xffffffff R18 = 0xffffffff R20 = 0xffffffff R21 = 0xffffffff R22 = 0xffffffff R24 = 0xffffffff R25 = 0xffffffff R26 = 0xffffffff R28 = 0xffffffff R29 = 0xffffffff R30 = 0xffffffff LR = 0x80113694 DSISR = 0xffffffff IMMR = 0xffffffff R3 = 0x00000000 R7 = 0x80570000 R11 = 0x00000000 R15 = 0xffffffff R19 = 0xffffffff R23 = 0xffffffff R27 = 0xffffffff R31 = 0xffffffff • frame-Displays an individual stack frame. • sysret-Displays return information from the last booted system image. This information includes the reason for terminating the image, a stack dump of up to eight frames, and, if an exception is involved, the address where the exception occurred; for example: rommon 8> sysret System Return Info: count: 19, reason: user break pc:0x801111b0, error address: 0x801111b0 Stack Trace: FP: 0x80005ea8, PC: 0x801111b0 FP: 0x80005eb4, PC: 0x80113694 FP: 0x80005f74, PC: 0x8010eb44 OL-16191-01 Cisco VG202 and Cisco VG204 Voice Gateways Software Configuration Guide A-7
-
 1
1 -
2
-
3
-
4
-
5
-
6
-
7
-
8
-
9
-
10
-
11
-
12
-
13
-
14
-
15
-
16
-
17
-
18
-
19
-
20
-
21
-
22
-
23
-
24
-
25
-
26
-
27
-
28
-
29
-
30
-
31
-
32
-
33
-
34
-
35
-
36
-
37
-
38
-
39
-
40
-
41
-
 42
42 -
 43
43 -
 44
44 -
 45
45 -
 46
46 -
 47
47 -
 48
48 -
 49
49 -
 50
50
 |
 |