D-Link DXS-3600-EM-STACK Hardware Installation Guide - Page 28
Areas of the User Interface, AREA 1
 |
View all D-Link DXS-3600-EM-STACK manuals
Add to My Manuals
Save this manual to your list of manuals |
Page 28 highlights
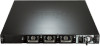
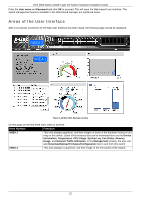
DXS-3600 Series 10GbE Layer 2/3 Switch Hardware Installation Guide Enter the User name and Password and click OK to proceed. This will open the Web-based User Interface. The switch management features available in the Web-based manager are explained below. Areas of the User Interface After a successful connection to the Web User Interface has been made, the following page should be displayed. AREA 2 AREA 1 Figure 4-12 Main Web Manager window On this page we will find three main areas to observe. Area Number Function AREA 1 This area displays graphical, real-time images of some of the hardware features running on this switch. Some of the features that can be monitored here are the Device Information, Temperature, CPU Usage, System Log, Fan Status, Memory Usage, and Network Traffic Utilization. In the Management window, the user can also Download/Upload Firmware/Configuration files to and from this switch. AREA 2 This area displays a graphical, real-time image of the front panel of the Switch. 22
-
 1
1 -
2
-
3
-
4
-
5
-
6
-
7
-
8
-
9
-
10
-
11
-
12
-
13
-
14
-
15
-
16
-
17
-
18
-
19
-
20
-
21
-
22
-
 23
23 -
 24
24 -
 25
25 -
 26
26 -
 27
27 -
 28
28 -
 29
29 -
 30
30 -
 31
31 -
 32
32 -
 33
33 -
34
-
35
-
36
 |
 |