HP 20b HP 20b Calculator Quick Start Guide - Page 36
Table 3-1, Month, Sales Values, Table 3-2, Display, Description - for sale
 |
UPC - 883585875344
View all HP 20b manuals
Add to My Manuals
Save this manual to your list of manuals |
Page 36 highlights
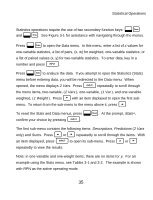
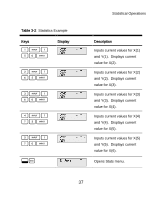
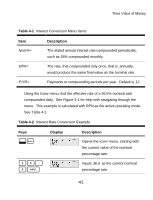
Statistical Operations Sales for the last five months are represented by the pairs of values shown below, with the month number as x, and the sales values as y. Enter these into the Data menu. Using the Stats menu for Predictions, predict sales for month seven. What is the slope and y-intercept of the linear regression line? What is the sum of all the y values? Table 3-1 Months and Sales Numbers Month 1 2 3 4 5 Sales Values 150 165 160 175 170 Table 3-2 Statistics Example Keys :y Display Description Opens Data menu starting with the current value for X(1). 36
-
 1
1 -
2
-
3
-
4
-
5
-
6
-
7
-
8
-
9
-
10
-
11
-
12
-
13
-
14
-
15
-
16
-
17
-
18
-
19
-
20
-
21
-
22
-
23
-
24
-
25
-
26
-
27
-
28
-
29
-
30
-
 31
31 -
 32
32 -
 33
33 -
 34
34 -
 35
35 -
 36
36 -
 37
37 -
 38
38 -
 39
39 -
 40
40 -
 41
41 -
42
-
43
-
44
-
45
-
46
-
47
-
48
-
49
-
50
-
51
-
52
-
53
-
54
-
55
-
56
-
57
-
58
-
59
-
60
-
61
-
62
-
63
-
64
-
65
-
66
-
67
-
68
-
69
-
70
-
71
-
72
-
73
-
74
-
75
-
76
-
77
-
78
-
79
-
80
-
81
-
82
-
83
-
84
-
85
-
86
-
87
-
88
-
89
-
90
-
91
-
92
-
93
-
94
-
95
 |
 |

Statistical Operations
36
Sales for the last five months are represented by the pairs of values shown
below, with the month number as
x
, and the sales values as
y
. Enter these
into the Data menu. Using the Stats menu for
Predictions
, predict sales for
month seven. What is the slope and y-intercept of the linear regression line?
What is the sum of all the y values?
Table 3-1
Months and Sales Numbers
Month
Sales Values
1
150
2
165
3
160
4
175
5
170
Table 3-2
Statistics Example
Keys
Display
Description
:y
Opens Data menu starting
with the current value for
X(1).