HP 20b HP 20b Calculator Quick Start Guide - Page 50
Cash Flows
 |
UPC - 883585875344
View all HP 20b manuals
Add to My Manuals
Save this manual to your list of manuals |
Page 50 highlights
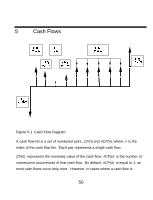
5 Cash Flows Cash Flows Figure 5-1 Cash Flow Diagram A cash flow list is a set of numbered pairs, CF(n) and #CF(n), where n is the index of the cash flow list. Each pair represents a single cash flow. CF(n) represents the monetary value of the cash flow; #CF(n) is the number of consecutive occurrences of that cash flow. By default, #CF(n) is equal to 1, as most cash flows occur only once. However, in cases where a cash flow is 50
-
 1
1 -
2
-
3
-
4
-
5
-
6
-
7
-
8
-
9
-
10
-
11
-
12
-
13
-
14
-
15
-
16
-
17
-
18
-
19
-
20
-
21
-
22
-
23
-
24
-
25
-
26
-
27
-
28
-
29
-
30
-
31
-
32
-
33
-
34
-
35
-
36
-
37
-
38
-
39
-
40
-
41
-
42
-
43
-
44
-
 45
45 -
 46
46 -
 47
47 -
 48
48 -
 49
49 -
 50
50 -
 51
51 -
 52
52 -
 53
53 -
 54
54 -
 55
55 -
56
-
57
-
58
-
59
-
60
-
61
-
62
-
63
-
64
-
65
-
66
-
67
-
68
-
69
-
70
-
71
-
72
-
73
-
74
-
75
-
76
-
77
-
78
-
79
-
80
-
81
-
82
-
83
-
84
-
85
-
86
-
87
-
88
-
89
-
90
-
91
-
92
-
93
-
94
-
95
 |
 |

Cash Flows
50
5
Cash Flows
Figure 5-1 Cash Flow Diagram
A cash flow list is a set of numbered pairs,
CF(n)
and
#CF(n)
, where
n
is the
index of the cash flow list. Each pair represents a single cash flow.
CF(n)
represents the monetary value of the cash flow;
#CF(n)
is the number of
consecutive occurrences of that cash flow. By default,
#CF(n)
is equal to
1
, as
most cash flows occur only once. However, in cases where a cash flow is