Netgear DM111PSP DM111PSP User Manual - Page 30
Viewing the ADSL Line Status, Table 2-2., Statistics Fields - reset
 |
View all Netgear DM111PSP manuals
Add to My Manuals
Save this manual to your list of manuals |
Page 30 highlights
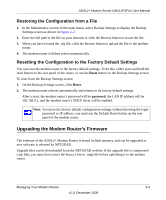
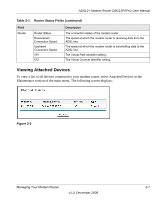
ADSL2+ Modem Router DM111PSPv2 User Manual Viewing the ADSL Line Status In the Maintenance section of the main menu, select ADSL Line Status to display the following screen: Figure 2-6 The upper table in Figure 2-6 indicates how the modem router has detected the ADSL parameters are configured, except for the "Line Up Time", which indicates the time elapsed since the last reset or power cycle. The lower table in Figure 2-6 provides information about the quality of upstream and downstream data. These statistics will be of interest to your technical support representative if you are having problems obtaining or maintaining a connection. Table 2-2 explains these statistics. Table 2-2. Statistics Fields Field Line Rate Attainable Line Rate Description Average data rates. The maximum attainable line rates. Typically, the downstream speed is faster than the upstream speed. 2-8 Managing Your Modem Router v1.0, December 2008
-
 1
1 -
2
-
3
-
4
-
5
-
6
-
7
-
8
-
9
-
10
-
11
-
12
-
13
-
14
-
15
-
16
-
17
-
18
-
19
-
20
-
21
-
22
-
23
-
24
-
 25
25 -
 26
26 -
 27
27 -
 28
28 -
 29
29 -
 30
30 -
 31
31 -
 32
32 -
 33
33 -
 34
34 -
 35
35 -
36
-
37
-
38
-
39
-
40
-
41
-
42
-
43
-
44
-
45
-
46
-
47
-
48
-
49
-
50
-
51
-
52
-
53
-
54
-
55
-
56
-
57
-
58
-
59
-
60
-
61
-
62
-
63
-
64
-
65
-
66
-
67
-
68
-
69
-
70
-
71
-
72
-
73
-
74
-
75
-
76
-
77
-
78
-
79
-
80
-
81
-
82
-
83
-
84
-
85
-
86
-
87
-
88
 |
 |
