| Section |
Page |
| Important Information |
2 |
| License |
2 |
| Setting up the TI-Nspire™ Navigator™ Teacher Software |
13 |
| Unpacking the boxes |
14 |
| Charging the cradles |
17 |
| Checking the LEDs |
17 |
| Installing the handheld software |
18 |
| Setting up your TI-Nspire™ Navigator™ network the first time |
20 |
| Before you begin |
20 |
| Connecting the cables to the access point |
21 |
| Checking the access point LEDS |
22 |
| Starting the wizard |
22 |
| Removing adapters or cradles from an existing network |
26 |
| Connecting the handhelds to the wireless adapters |
26 |
| Connecting the handhelds to the cradles |
28 |
| Storing the wireless adapters and cradles |
30 |
| Checking the status of wireless adapters and cradles |
30 |
| Identifying selected cradles |
31 |
| Now that you know where the non-working cradles are, you can add the cradles to the network again. |
32 |
| Cradle LEDs |
32 |
| Creating and managing your teacher account |
32 |
| Creating your teacher account |
33 |
| Changing the password of your teacher account |
34 |
| Changing the user name of your teacher account |
35 |
| Logging in to the TI-Nspire™ Navigator™ system from the handheld |
36 |
| Logging in to the TI-Nspire™ Navigator™ network |
36 |
| TI-Nspire™ handheld login status icons |
37 |
| Getting started with the TI-Nspire™ Navigator™ Teacher Software |
39 |
| Navigating through the Welcome Screen icons |
40 |
| Opening the Welcome Screen manually |
41 |
| Exploring the TI-Nspire™ Navigator™ Teacher software |
41 |
| Understanding the status bar |
42 |
| Exploring workspaces |
43 |
| Changing language |
43 |
| Using help |
44 |
| Note: Aside from viewing your current software version, you must be connected to the Internet to perform any of these tasks. You do not need to be connected to the Internet to view your current version of software as shown in the About command. |
45 |
| Using the Content Workspace |
47 |
| Understanding the status bar |
48 |
| Exploring the Resources pane |
49 |
| Exploring the Content pane |
50 |
| Using the content pane tool bar |
51 |
| Using the Preview pane |
51 |
| Using shortcuts |
53 |
| Working with Links |
53 |
| Using the Links toolbar |
53 |
| Adding a link |
54 |
| Editing an existing link |
55 |
| Removing a link |
55 |
| Moving links up or down in the list |
55 |
| Using Web Content |
56 |
| Sorting the list of activities |
57 |
| Filtering the list of activities |
57 |
| Using keywords to search for an activity |
57 |
| Opening an activity |
58 |
| Saving an activity to your computer |
58 |
| Copying an activity |
59 |
| Sending an activity to a connected handheld |
59 |
| Working with connected handhelds |
60 |
| Viewing content on connected handhelds |
61 |
| Using Identify Selected to locate handhelds |
63 |
| Performing tasks on connected handhelds |
63 |
| Managing files on a connected handheld |
63 |
| Renaming handhelds |
65 |
| Working with lesson bundles |
65 |
| Creating a new lesson bundle |
66 |
| Adding files to a lesson bundle |
66 |
| Opening a lesson bundle |
69 |
| Managing files in a lesson bundle |
70 |
| Managing lesson bundles |
71 |
| Packaging lesson bundles |
72 |
| E-mailing a lesson bundle |
73 |
| Sending files to a class |
73 |
| Understanding the rules of content transfer |
74 |
| Types of content you can transfer |
74 |
| Methods you can use to transfer content |
75 |
| Using menus and toolbar icons |
75 |
| Using the Transfer Tool |
85 |
| Transfer Tool interface |
85 |
| Setup tab |
85 |
| Status tab |
87 |
| Opening the Transfer Tool |
87 |
| Adding files or folders to the Transfer List |
88 |
| Removing files or folders from the Transfer List |
89 |
| Editing the destination folder |
90 |
| Deleting all handheld files and folders |
91 |
| Starting a transfer |
92 |
| Stopping file transfers |
93 |
| Closing the Transfer Tool |
93 |
| Using the Documents Workspace |
95 |
| Using the Documents Toolbox |
96 |
| Exploring the Tool Palette |
97 |
| Exploring the Page Sorter Panel |
99 |
| Exploring the TI-SmartView™ Panel |
99 |
| Exploring the Utilities panel |
101 |
| Exploring the Content Explorer panel |
102 |
| Using the workspace |
104 |
| Understanding the status bar |
105 |
| Viewing and changing document settings |
106 |
| Changing General settings |
106 |
| Changing Graphs & Geometry settings |
108 |
| Sending files to a class |
110 |
| Sending files to a handheld |
111 |
| Working with Lesson Bundles |
112 |
| Creating a new lesson bundle |
112 |
| Adding files to a lesson bundle |
112 |
| Opening a lesson bundle |
114 |
| Managing files in lesson bundles |
115 |
| Packaging lesson bundles |
115 |
| E-mailing a lesson bundle |
116 |
| Managing lesson bundles |
116 |
| Sending lesson bundles to connected handhelds |
117 |
| Updating the handheld OS |
117 |
| Using menus and toolbar icons |
118 |
| Working with TI-Nspire™ documents |
131 |
| About documents |
131 |
| TI-Nspire™ documents |
131 |
| PublishView™ documents |
131 |
| Managing TI-Nspire™ documents |
132 |
| Creating a new TI-Nspire™ document |
132 |
| Saving TI-Nspire™ documents |
133 |
| Saving a document with a new name |
133 |
| Opening an existing document |
134 |
| Using Content Explorer to locate files |
134 |
| Opening Content Explorer |
134 |
| Understanding which files and folders you can transfer |
136 |
| Saving a document to a connected handheld |
136 |
| Opening handheld documents in the software |
137 |
| Saving handheld documents in the software |
138 |
| Copying supported files and folders |
138 |
| Working with multiple documents |
139 |
| Working with multiple documents in tiled view |
139 |
| Closing documents |
140 |
| Working with applications |
140 |
| Opening Document Tools |
141 |
| Opening context menus |
142 |
| Working with multiple applications in a page |
143 |
| Adding multiple applications to a page |
143 |
| Swapping applications |
144 |
| Selecting and moving pages with the Page Sorter |
144 |
| Selecting pages |
145 |
| Grouping applications |
146 |
| Deleting an application from a page |
146 |
| Deleting pages |
146 |
| Working with problems and pages |
146 |
| Adding a problem to a document |
146 |
| Adding a page to a problem |
147 |
| Copying, pasting, and deleting problems |
147 |
| Renaming a problem |
147 |
| Using Utilities in documents |
148 |
| Inserting items from the Utilities pane |
151 |
| Using wizards |
151 |
| Using colors in documents |
152 |
| Adding color from a list |
152 |
| Adding color from a palette |
152 |
| Using Screen Capture |
153 |
| Capturing a page |
153 |
| Saving captured pages |
155 |
| Printing documents |
155 |
| Using print preview |
156 |
| Viewing document properties and copyright information |
156 |
| Viewing copyright information |
156 |
| Protecting a document (making a document read-only) |
157 |
| Adding copyright information to a document |
157 |
| Capturing Screens |
159 |
| Accessing Screen Capture |
159 |
| Using Capture Class |
160 |
| Capturing student handheld screens |
160 |
| Using the Class Capture window menus and tool bar |
162 |
| Setting Teacher Preferences for Capture Class |
164 |
| Setting view options in Capture Class |
165 |
| Toggling between Tiled and Gallery views |
165 |
| Rearranging captured screens |
166 |
| Refreshing captured screens |
167 |
| Using zoom in and zoom out |
168 |
| Comparing selected screens |
169 |
| Using Make Presenter |
169 |
| Saving screens when using Capture Class |
170 |
| Saving screen images |
170 |
| Printing captured screens |
171 |
| Using Capture Page |
172 |
| Capturing a page |
172 |
| Using Capture Selected Handheld |
173 |
| Viewing captured screens |
174 |
| Using the Screen Capture window menu and tool bar |
175 |
| Zooming the view of captured screens |
176 |
| Saving captured pages and handheld screens |
177 |
| Saving selected screens |
177 |
| Saving multiple screens |
178 |
| Copying and pasting a screen |
178 |
| Copying a screen |
179 |
| Pasting a screen |
179 |
| Working with Images |
181 |
| TI-Nspire™ applications that can accept images |
181 |
| Example applications using images |
182 |
| Image types available |
183 |
| Inserting the image |
183 |
| Using the Insert command |
184 |
| Using Clipboard |
185 |
| Working with images |
186 |
| Selecting the image |
186 |
| Moving an image |
187 |
| Resizing image |
187 |
| Deleting the image |
187 |
| Technical considerations |
188 |
| Working with PublishView™ documents |
189 |
| Software requirements |
189 |
| Creating a new PublishView™ document |
190 |
| About PublishView™ documents |
191 |
| Exploring a PublishView™ document |
192 |
| Using the status bar in a PublishView™ document |
194 |
| Saving PublishView™ documents |
195 |
| Saving a new document |
195 |
| Saving a document with a new name |
195 |
| Exploring the Documents workspace |
196 |
| Exploring the Documents Toolbox |
196 |
| Using menus and the toolbar |
198 |
| Using context menus |
199 |
| Working with PublishView™ objects |
200 |
| Inserting an object |
201 |
| Opening object context menus |
202 |
| Resizing an object |
202 |
| Moving an object |
203 |
| Overlapping objects |
204 |
| Deleting an object |
204 |
| Choosing a working folder for PublishView™ objects |
205 |
| Working with TI-Nspire™ applications |
206 |
| Adding an application to a problem |
206 |
| Adding existing TI-Nspire™ documents |
208 |
| Working with problems |
210 |
| Adding a problem |
210 |
| Managing problem breaks |
211 |
| Hiding and showing problem breaks |
211 |
| Renaming a problem |
211 |
| Deleting a problem |
211 |
| Organizing PublishView™ sheets |
212 |
| Adding sheets to a problem |
212 |
| Opening the sheet context menu |
212 |
| Page numbering |
212 |
| Working with headers and footers |
213 |
| Showing and hiding borders |
214 |
| Adding and removing space |
214 |
| Deleting blank sheets from problems |
217 |
| Adding text to a PublishView™ document |
217 |
| Inserting text into a text box |
217 |
| Formatting and editing text |
219 |
| Launching edit mode |
219 |
| Opening the content context menu |
219 |
| Using hyperlinks in PublishView™ documents |
219 |
| Linking to a file |
220 |
| Linking to a web site |
222 |
| Editing a hyperlink |
222 |
| Converting existing text to a hyperlink |
223 |
| Removing a hyperlink |
223 |
| Working with images |
224 |
| Inserting an image |
224 |
| Moving images |
225 |
| Resizing images |
226 |
| Deleting images |
226 |
| Working with video files |
226 |
| Inserting a video |
226 |
| Using the video console |
227 |
| Using the video context menu |
228 |
| Adjusting Adobe® Flash® Player settings |
228 |
| Converting documents |
228 |
| Converting PublishView™ documents to TI-Nspire documents |
229 |
| Converting TI-Nspire™ documents to PublishView™ documents |
230 |
| Printing PublishView™ documents |
231 |
| Embedding documents in web pages |
233 |
| Using embedded web pages |
233 |
| Viewing embedded web pages |
233 |
| Using TI-Nspire™ HTML Inline Frames |
234 |
| Iframe tags and attributes |
235 |
| Using the Source (src) attribute |
235 |
| Defining the nspirefile parameter |
235 |
| Using other iframe attributes |
236 |
| Using dynamically-generated iframes |
237 |
| Using the TI-Nspire™ Document Player |
238 |
| Exporting to a web page |
238 |
| Exploring the web page |
240 |
| Customizing an embedded TI-Nspire™ Document Player |
241 |
| Using Export to generate source code |
245 |
| Export options |
245 |
| Viewing the source code |
245 |
| Exporting to the clipboard |
250 |
| Editing the code snippet |
250 |
| Storing and sharing your documents |
251 |
| Storing documents to be shared online |
251 |
| Modifying the parameter |
252 |
| Storing and sharing files offline |
254 |
| Launching a dedicated TI-Nspire™ Document Player window |
254 |
| Using the Class Workspace |
257 |
| Understanding the status bar |
258 |
| Adding classes |
258 |
| Adding a class |
258 |
| Importing students |
259 |
| Removing classes |
261 |
| Removing a class |
261 |
| Adding students to classes |
261 |
| Removing students from classes |
263 |
| Beginning and ending a class session |
264 |
| Beginning a class session |
264 |
| Pausing a class session |
264 |
| Ending a class session |
264 |
| Changing the student view |
265 |
| Changing the class view to Student List |
265 |
| Changing the class view to Seating Chart |
265 |
| Arranging the seating chart |
266 |
| Arranging students in the seating chart |
266 |
| Checking student login status |
266 |
| Sorting student information |
267 |
| Sorting student information |
267 |
| Changing the classes assigned to a student |
267 |
| Changing a student’s class |
267 |
| Changing student names and identifiers |
269 |
| Changing a student’s names or identifiers |
269 |
| Moving students to another class |
270 |
| Moving a student to another class |
270 |
| Copying students to another class |
271 |
| Copying a student to another class |
271 |
| Exploring the Class Record |
272 |
| Sending files to a class |
273 |
| Collecting files from students |
275 |
| Collecting files from the Class Record |
275 |
| Collecting files from the menu or icon |
276 |
| Managing Unprompted actions |
277 |
| Reviewing and opening Unprompted actions |
278 |
| Viewing items in an Unprompted action |
278 |
| Removing individual items from an Unprompted action |
278 |
| Removing an entire Unprompted action |
279 |
| Exporting Unprompted action items |
279 |
| Saving files to a Portfolio record |
279 |
| Deleting files from handhelds |
280 |
| Checking the status of file transfers |
281 |
| Canceling file transfers |
282 |
| Deleting items from the Class Record |
282 |
| Viewing file properties |
283 |
| Resetting student passwords |
283 |
| Resetting passwords for all students in a class |
283 |
| Resetting passwords for individual students |
284 |
| Using menus and toolbar icons |
285 |
| Using Live Presenter |
293 |
| Before starting Live Presenter |
293 |
| Starting Live Presenter |
293 |
| Starting Live Presenter from Class Screen Capture window |
293 |
| Exploring Live Presenter mode |
294 |
| Hiding and showing student names |
296 |
| Hiding and showing the presenter handheld |
297 |
| Hiding the handheld display |
297 |
| Showing the handheld |
298 |
| Viewing Keypress History |
298 |
| Hiding Keypress History |
299 |
| Showing Keypress History |
299 |
| Copying Keypress History |
299 |
| Clearing Keypress History |
300 |
| Showing the handheld screen only |
300 |
| Recording the live presentation |
301 |
| Starting the recording |
301 |
| Stopping and saving the recording |
301 |
| Playing and sharing the recording |
302 |
| Stopping Live Presenter |
302 |
| Using Question in the Teacher Software |
303 |
| Understanding the Question Tool Palette |
303 |
| Understanding the configuration tool |
304 |
| Adding configuration options |
304 |
| Using the Teacher Tool Palette |
305 |
| Adding images to questions |
306 |
| Image types available |
306 |
| Adding images using the Insert command |
307 |
| Adding images using the clipboard |
307 |
| Adding questions |
307 |
| Adding a custom multiple choice question |
308 |
| Adding an open response question |
310 |
| Adding an equation question |
311 |
| Adding an (x,y) numerical input question |
313 |
| Adding a drop points question |
314 |
| Adding a lists question |
316 |
| Using Question for Students |
317 |
| Accessing the Question Toolbar |
317 |
| Understanding the Question toolbar |
317 |
| Navigating in the Question application |
318 |
| Types of questions |
318 |
| Answering questions |
319 |
| Checking your Answer |
319 |
| Multiple Choice |
320 |
| Open Response |
321 |
| Equation |
321 |
| Coordinate Points, Drop Points, and and List |
323 |
| Polling students |
327 |
| Opening the Quick Poll tool |
328 |
| Sending a Quick Poll |
330 |
| Using the Quick Poll menu |
330 |
| Stopping polls |
330 |
| Saving polls |
331 |
| Viewing poll results |
331 |
| Responding to polls (student instruction) |
333 |
| Navigating the handheld in a Quick Poll question |
333 |
| Responding to Quick Poll questions |
333 |
| Clearing your answers |
335 |
| Submitting Quick Poll responses |
335 |
| Using the Review Workspace |
337 |
| Understanding the status bar |
338 |
| Using the Review toolbox |
339 |
| Exploring the Review tools |
339 |
| Exploring the Page sorter |
340 |
| Exploring the Student pane |
341 |
| Exploring the Data View pane |
344 |
| Understanding the Data View |
344 |
| Opening documents for review |
347 |
| Opening a document from the Class workspace |
347 |
| Opening a document from the Portfolio workspace |
348 |
| Viewing data |
349 |
| Viewing data from the Student pane |
349 |
| Viewing data from the Data View pane |
349 |
| Organizing responses |
351 |
| Configuring a plot list |
351 |
| Individualizing student responses |
352 |
| Organizing list data |
353 |
| Organizing bar chart data |
353 |
| Organizing by equivalency |
355 |
| Hiding and showing responses |
355 |
| Hiding responses from the Student pane |
356 |
| Hiding responses from the Data View pane |
357 |
| Showing responses |
358 |
| Marking responses as correct or incorrect |
359 |
| Adding teacher data |
363 |
| Adding teacher points |
364 |
| Adding teacher equations |
365 |
| Saving to the Portfolio workspace |
366 |
| Using menus and toolbar icons |
367 |
| Using the Portfolio Workspace |
375 |
| Understanding the status bar |
376 |
| Exploring the Assignments pane |
376 |
| Exploring the Workspace views |
377 |
| Assignments Summary View |
377 |
| Individual Assignment View |
378 |
| Saving an item to the Portfolio workspace |
379 |
| Importing an item to Portfolio |
380 |
| Editing scores |
381 |
| Changing a student’s score for an item |
381 |
| Changing the total possible points for a question |
382 |
| Changing the final percentage score |
382 |
| Exporting results |
383 |
| Sorting information in Portfolio |
383 |
| Opening a Portfolio item in another workspace |
384 |
| Opening an item in the Documents workspace |
384 |
| Opening an item in the Review workspace |
384 |
| Opening a Master Document |
385 |
| Adding a Master Document |
385 |
| Redistributing a Portfolio item |
386 |
| Collecting missing files from students |
386 |
| Sending missing files to students |
387 |
| Renaming a Portfolio item |
387 |
| Removing files from Portfolio |
387 |
| Using menus and toolbar icons |
388 |
| Using the Scratchpad |
395 |
| Opening and closing the Scratchpad |
395 |
| Calculating with the Scratchpad |
396 |
| Entering simple math expressions |
396 |
| Inserting items from the Catalog |
397 |
| Using an expression template |
398 |
| Inserting expressions using a wizard |
399 |
| Viewing the history |
401 |
| Copying a history item to the entry line |
402 |
| Clearing the history |
402 |
| Editing Scratchpad expressions |
402 |
| Inserting elements into the entry line |
402 |
| Selecting part of an expression |
402 |
| Graphing with the Scratchpad |
403 |
| Viewing the function table |
404 |
| Changing the appearance of the axes |
404 |
| Tracing a graphed function |
405 |
| Finding points of interest |
406 |
| Working with variables in the Scratchpad |
407 |
| Saving the Scratchpad contents |
408 |
| Clearing Scratchpad contents |
408 |
| Calculator |
409 |
| Getting started with the Calculator application |
409 |
| Calculator menu |
410 |
| Entering and evaluating math expressions |
416 |
| Entering simple math expressions |
416 |
| Controlling the form of a result |
416 |
| Inserting items from the Catalog |
417 |
| Using an expression template |
419 |
| Creating matrices |
419 |
| Inserting a row or column into a matrix |
420 |
| Inserting expressions using a wizard |
420 |
| Creating a piecewise function |
422 |
| Creating a system of equations |
423 |
| Deferring evaluation |
423 |
| Working with variables |
423 |
| CAS: Working with measurement units |
424 |
| CAS: Converting between measurement units |
424 |
| CAS: Creating a user-defined unit |
425 |
| Creating user-defined functions and programs |
426 |
| Defining a single-line function |
426 |
| Defining a multiple-line function using templates |
426 |
| Defining a multiple-line function manually |
428 |
| Defining a program |
428 |
| Recalling a function or program definition |
430 |
| Editing Calculator expressions |
430 |
| Positioning the cursor in an expression |
430 |
| Inserting into an expression in the entry line |
430 |
| Selecting part of an expression |
431 |
| Deleting all or part of an expression on the entry line |
431 |
| Financial calculations |
431 |
| Using the Finance Solver |
431 |
| Finance functions included |
432 |
| Working with the Calculator history |
433 |
| Viewing the Calculator history |
433 |
| Copying a Calculator history item to the entry line |
433 |
| Copying a history item to another application |
434 |
| Deleting an expression from the history |
434 |
| Clearing the Calculator history |
435 |
| Using Variables |
437 |
| Linking values on pages |
437 |
| Creating variables |
437 |
| Types of variables |
438 |
| Creating a variable from a Calculator value |
438 |
| Creating a variable in the computer software |
439 |
| Checking a variable’s value |
439 |
| Automatically creating variables in Graphs & Geometry |
439 |
| Creating a variable from a Graphs & Geometry value |
440 |
| Automatically creating variables in Lists & Spreadsheet |
441 |
| Creating a variable from a Lists & Spreadsheet cell value |
442 |
| Using (linking) variables |
443 |
| Linking to shared variables |
443 |
| Linking a Lists & Spreadsheet cell to a variable |
443 |
| Using a variable in a calculation |
444 |
| Entering multiple statements on the entry line |
444 |
| Setting variable values with a slider |
445 |
| Naming variables |
445 |
| Locking and unlocking variables |
447 |
| Variables you cannot lock |
447 |
| Important information about locked variables |
447 |
| Examples of locking |
447 |
| Updating a variable |
448 |
| Reusing the last answer |
448 |
| Temporarily substituting a value for a variable |
449 |
| Removing a linked variable |
449 |
| Graphs & Geometry |
451 |
| Getting started with Graphs & Geometry |
451 |
| Graphs & Geometry menu |
452 |
| Using keystroke shortcuts |
462 |
| Using the context menu |
463 |
| Using the work area |
464 |
| Grabbing and dragging items in the work area |
464 |
| Panning the work area |
464 |
| Adding text |
464 |
| Working with multiple objects |
465 |
| Working with color |
467 |
| Understanding attributes |
468 |
| Changing an attribute of an object |
470 |
| Locking measured values and points |
471 |
| Graphs & Geometry views |
472 |
| Summary of view differences |
472 |
| Using the Graphing View |
473 |
| Creating an object in the Graphing View |
474 |
| Customizing the work area |
474 |
| Panning views |
474 |
| Showing/hiding the axes and other elements |
474 |
| Changing the appearance of the axes |
475 |
| Zooming/rescaling the work area |
475 |
| Inserting a background image |
476 |
| Adjusting variable values with a slider |
477 |
| Inserting a slider |
477 |
| Setting up the slider |
478 |
| Adjusting a slider variable’s current value |
479 |
| Repositioning a slider on the page |
479 |
| Mimimizing a slider |
479 |
| Stretching a slider |
479 |
| Animating a slider |
480 |
| Removing a slider |
480 |
| Tips for using sliders |
480 |
| Using the Trace tools |
480 |
| Tracing a graph or plot |
481 |
| Tracing all graphs |
482 |
| Working with relations |
482 |
| Using the entry line |
482 |
| Displaying relation history |
485 |
| Finding points of interest |
485 |
| Specifying a function with domain restrictions |
486 |
| Graphing a family of functions |
487 |
| Creating a time plot or web plot sequence |
488 |
| Creating a custom plot for a sequence |
490 |
| Graphing differential equations |
492 |
| Summary of Differential Equation settings |
494 |
| Using the Text tool to enter functions |
496 |
| Graphing inequalities |
497 |
| Renaming f(x) |
497 |
| Editing functions |
498 |
| Hiding a function on the work area |
499 |
| Deleting a function |
500 |
| Manipulating functions |
500 |
| Manipulating a linear function |
502 |
| Manipulating a quadratic function |
503 |
| Manipulating a sine or cosine function |
504 |
| Finding the derivative at a point (the slope) |
504 |
| Viewing function tables |
505 |
| Using the Plane Geometry View |
506 |
| Creating an object in Plane Geometry View |
506 |
| Using the analytic window |
508 |
| Working with Cabri™ II Plus files |
508 |
| Using Geometry Trace |
509 |
| Grouping objects |
510 |
| Pinning objects |
510 |
| Working with points and lines |
511 |
| Working with points |
511 |
| Working with linear objects |
516 |
| Creating and working with shapes |
521 |
| Measuring objects |
525 |
| Transferring measurements |
530 |
| Using the Calculate tool |
533 |
| Transforming objects |
534 |
| Performing other investigations |
538 |
| Animating points |
542 |
| Graphing 3D functions |
545 |
| Defining a 3D graph |
545 |
| Displaying the context menu of a 3D graph |
545 |
| Editing a 3D graph |
546 |
| Setting the appearance of a 3D graph |
546 |
| Showing and hiding 3D graphs |
548 |
| Customizing the 3D viewing environment |
548 |
| Rotating the 3D view |
549 |
| Tracing in the 3D view |
549 |
| Animating a 3D graph with a slider |
550 |
| Using Lists & Spreadsheet |
553 |
| Getting started with tabular data |
553 |
| The menu and work area |
554 |
| Lists & Spreadsheet menu |
554 |
| The Parts of a Spreadsheet |
557 |
| Navigating in a spreadsheet |
558 |
| Creating and sharing spreadsheet data as lists |
558 |
| Sharing a spreadsheet column as a list variable |
558 |
| Linking to an existing list variable |
559 |
| Inserting an element in a list |
560 |
| Deleting an element from a list |
560 |
| Creating spreadsheet data |
560 |
| Data examples |
561 |
| Typing a math expression, text, or spreadsheet formula |
561 |
| Inserting a cell range into a formula |
562 |
| Working with cells |
563 |
| Working with color |
563 |
| Understanding cell references in formulas |
563 |
| Typing a cell reference in a formula |
564 |
| Deleting the contents of cells |
564 |
| Copying cells |
564 |
| Filling adjacent cells |
565 |
| Sharing a cell value as a variable |
565 |
| Linking a cell to a variable |
566 |
| Working with rows and columns of data |
566 |
| Selecting a row or column |
566 |
| Resizing a row or column |
566 |
| Inserting an empty row or column |
567 |
| Deleting entire rows or columns |
567 |
| Copying rows or columns |
567 |
| Moving a column |
568 |
| Clearing column data |
568 |
| Sorting data |
569 |
| Generating columns of data |
569 |
| Creating column values based on another column |
570 |
| Generating a column of random numbers |
571 |
| Generating a numerical sequence |
571 |
| Graphing spreadsheet data |
573 |
| Using Quick Graph |
573 |
| Creating a summary plot from a summary table |
574 |
| Exchanging data with other computer software |
576 |
| Example - copying data from TI DataEditor |
577 |
| Copying cells from an Excel® spreadsheet |
578 |
| Capturing data from Graphs & Geometry |
578 |
| Capturing data manually |
579 |
| Capturing data automatically |
580 |
| Using table data for statistical analysis |
581 |
| Plotting statistical data |
582 |
| Statistics Input Descriptions |
582 |
| Statistical calculations |
584 |
| Performing a statistical calculation |
584 |
| Storing statistical results |
585 |
| Supported statistical calculations |
585 |
| Distributions |
588 |
| Calculating distributions |
588 |
| Supported Distribution functions |
589 |
| Confidence Intervals |
593 |
| Supported Confidence Intervals |
593 |
| Stat Tests |
595 |
| Supported Statistical tests |
595 |
| Working with function tables |
600 |
| Switching to a Table |
600 |
| Making changes from a table |
601 |
| Using Data & Statistics |
603 |
| Data & Statistics menu |
604 |
| Getting started with the Data & Statistics application |
609 |
| Using the default case plot |
610 |
| Navigating in the Data & Statistics application |
610 |
| Using the axes |
611 |
| Using the context menu |
611 |
| Selecting data and displaying summary information |
611 |
| Plotting variables |
611 |
| Manipulating plotted data |
613 |
| Overview of raw and summary data |
613 |
| Working with numeric plot types |
614 |
| Creating dot plots |
614 |
| Creating box plots |
615 |
| Plotting histograms |
618 |
| Creating a normal probability plot |
621 |
| Creating a Scatter Plot |
621 |
| Creating an X-Y line plot |
622 |
| Working with categorical plot types |
623 |
| Creating a dot chart |
623 |
| Creating a bar chart |
625 |
| Creating a bar chart from a frequency table or summary data |
626 |
| Creating a pie chart |
627 |
| Creating a comparative bar chart |
628 |
| Splitting a numeric plot by categories |
629 |
| Exploring data |
631 |
| Moving points or bins of data |
632 |
| Moving multiple points |
632 |
| Sorting plotted categories |
633 |
| Plotting a value |
633 |
| Removing a plotted value |
635 |
| Changing the plot type |
635 |
| Rescaling a graph |
635 |
| Adding a movable line |
636 |
| Rotating a movable line |
637 |
| Tracing a movable line |
638 |
| Showing a line of regression |
638 |
| Showing residual squares |
639 |
| Showing a residual plot |
640 |
| Removing a residual plot |
640 |
| Using Window/Zoom tools |
640 |
| Graphing Functions |
641 |
| Graphing functions using the Plot Function tool |
642 |
| Entering functions from other applications |
643 |
| Editing a function |
644 |
| Using Data & Statistics functions in other applications |
644 |
| Using Show Normal PDF |
644 |
| Using Shade Under Function |
645 |
| Using Graph Trace |
646 |
| Customizing your workspace |
647 |
| Working with color |
647 |
| Inserting a background image |
647 |
| Working with text |
648 |
| Adjusting variable values with a slider |
648 |
| Inserting a slider |
649 |
| Setting up the slider |
650 |
| Adjusting a slider variable’s current value |
651 |
| Repositioning a slider on the page |
651 |
| Mimimizing a slider |
651 |
| Stretching a slider |
651 |
| Animating a slider |
652 |
| Removing a slider |
652 |
| Tips for using sliders |
652 |
| Inferential Statistics |
652 |
| Drawing inferential statistics plots |
652 |
| Exploring inferential statistics plots |
654 |
| Using Notes |
655 |
| Getting started with the Notes application |
655 |
| Using the Notes menu |
655 |
| Opening Notes |
656 |
| Using templates |
657 |
| Selecting a template |
658 |
| Using the Q&A template |
658 |
| Using the proof template |
658 |
| Formatting text in Notes |
659 |
| Selecting text |
660 |
| Applying a text format |
660 |
| Using color in Notes |
660 |
| Changing text colors |
661 |
| Applying a background color |
661 |
| Inserting Images |
661 |
| Resizing an image |
662 |
| Inserting math expressions, shapes, or comments |
662 |
| Inserting comments |
662 |
| Inserting geometric shape symbols |
663 |
| Entering math expressions |
664 |
| Entering an expression |
664 |
| Evaluating and approximating math expressions |
665 |
| Evaluating or approximating an expression |
665 |
| Evaluating part of an expression |
666 |
| Breaking long calculations |
666 |
| Showing warnings and errors |
666 |
| Converting selected items to math expression boxes |
667 |
| Deactivating math expression boxes |
667 |
| Deactivating a box or a group of boxes |
667 |
| Deactivating all boxes in the Notes application |
667 |
| Changing the attributes of math expression boxes |
668 |
| Undoing changes to math expression boxes |
668 |
| Using calculations in Notes |
668 |
| Important information to know |
669 |
| Using hints on the handheld |
671 |
| Exploring Notes with examples |
671 |
| Example #1: Using Notes to explore roots of a quadratic function |
672 |
| Example #2: Using Notes to explore data sampling |
673 |
| Libraries |
677 |
| What is a library? |
677 |
| Creating libraries and library objects |
678 |
| Private and Public library objects |
678 |
| Using short and long names |
679 |
| Using library objects |
679 |
| Refreshing the libraries |
680 |
| Using a public library object |
680 |
| Using a private library object |
680 |
| Creating shortcuts to library objects |
680 |
| Included libraries |
681 |
| Restoring an included library |
681 |
| Changing the library folder location (computer only) |
682 |
| Programming |
685 |
| Overview of the Program Editor |
685 |
| Program Editor menu |
686 |
| Defining a program or function |
689 |
| Starting a new Program Editor |
689 |
| Entering lines into a function or program |
690 |
| Inserting comments |
691 |
| Checking syntax |
691 |
| Storing the function or program |
692 |
| Viewing a program or function |
692 |
| Opening a function or program for editing |
693 |
| Importing a program from a library |
693 |
| Creating a copy of a function or program |
694 |
| Renaming a program or function |
694 |
| Changing the library access level |
695 |
| Finding text |
695 |
| Finding and replacing text |
695 |
| Closing the current function or program |
696 |
| Running programs and evaluating functions |
696 |
| Using short and long names |
697 |
| Using a Public library function or program |
697 |
| Using a Private library function or program |
698 |
| Running a non-library program or function |
698 |
| Interrupting a running program |
699 |
| Getting values into a program |
699 |
| Embedding the values within the program or function |
699 |
| Letting the user assign the values to variables |
699 |
| Letting the user supply the values as arguments |
700 |
| Requesting the values from the user (programs only) |
700 |
| Displaying information |
701 |
| Displaying information in the history |
701 |
| Displaying information in a dialog box |
701 |
| Using local variables |
702 |
| Example of a local variable |
702 |
| What causes an undefined variable error message? |
702 |
| Initialize local variables |
703 |
| CAS: Performing symbolic calculations |
703 |
| Differences between functions and programs |
703 |
| Calling one program from another |
704 |
| Calling a separate program |
704 |
| Defining and calling an internal subroutine |
704 |
| Notes about using subroutines |
705 |
| Avoiding circular-definition errors |
705 |
| Controlling the flow of a function or program |
706 |
| Using If, Lbl, and Goto to control program flow |
706 |
| If command |
706 |
| If...Then...EndIf structures |
707 |
| If...Then...Else...EndIf structures |
707 |
| If...Then...ElseIf... EndIf structures |
707 |
| Lbl and Goto commands |
708 |
| Using loops to repeat a group of commands |
708 |
| For...EndFor loops |
709 |
| While...EndWhile loops |
710 |
| Loop...EndLoop loops |
711 |
| Repeating a loop immediately |
712 |
| Lbl and Goto loops |
712 |
| Changing mode settings |
712 |
| Setting a mode |
712 |
| Debugging programs and handling errors |
713 |
| Techniques for debugging |
713 |
| Error-handling commands |
713 |
| Data Collection and Analysis |
715 |
| Chapter organization |
715 |
| Introduction and navigation |
716 |
| Using a computer or handheld |
717 |
| Special instructions for PC users |
717 |
| Special instructions for Macintosh® users |
717 |
| Special instructions for handheld users |
717 |
| Navigating the screens |
718 |
| Understanding the computer view |
718 |
| Understanding the handheld view |
719 |
| Understanding the Application screen sections |
721 |
| Selecting views |
722 |
| Selecting Meter View |
722 |
| Selecting Graph View |
722 |
| Selecting Table View |
723 |
| Performing an experiment |
723 |
| Experiment Details |
726 |
| Starting a new document or problem |
726 |
| Starting a new document |
727 |
| Adding a problem |
727 |
| Connecting a sensor |
728 |
| Data collection devices |
728 |
| Sensor Interfaces: |
728 |
| Sensors |
729 |
| Direct-Connect USB Sensors |
729 |
| Setting and using a collection mode |
730 |
| Setting a Time Based collection mode |
731 |
| Using Time Based collection mode |
732 |
| Setting Events with Entry |
733 |
| Using Events with Entry |
733 |
| Setting Selected Events |
734 |
| Using Selected Events |
735 |
| Using Photogate Timing |
735 |
| Using Drop Counting |
736 |
| Modifying sensor settings |
736 |
| Changing sensor units |
736 |
| Calibrating a sensor |
737 |
| Zeroing a sensor |
737 |
| Reversing a sensor |
737 |
| Starting a data collection |
738 |
| Using the Keep option |
738 |
| Defining Collection Mode as Selected Events |
739 |
| Defining Collection Mode as Events with Entry |
739 |
| Stopping a collection |
740 |
| Analyzing data |
740 |
| Examining data points |
740 |
| Interpolate |
740 |
| Tangent |
741 |
| Examine Settings |
742 |
| Data analysis calculations |
744 |
| Integral |
744 |
| Statistics |
745 |
| Curve Fit |
746 |
| Model |
748 |
| Removing analysis options |
751 |
| Examining the View Details area data |
751 |
| Opening a View Details area dialog box |
752 |
| Expanding the View Details area |
752 |
| Showing and hiding details |
754 |
| Storing data |
755 |
| Saving an experiment |
755 |
| Working with data and Graph View |
755 |
| Showing graphs |
756 |
| Showing Graph 1 |
757 |
| Showing Graph 2 |
758 |
| Showing both graphs |
758 |
| Adding a title to a graph |
759 |
| Setting min and max axis ranges |
760 |
| Setting the axis range using the menu |
760 |
| Setting the axis range from the window |
761 |
| Selecting a Data Set to plot |
763 |
| Using autoscale |
764 |
| Using autoscale now |
764 |
| Defining autoscale during a collection |
764 |
| Defining autoscale after a collection |
764 |
| Using zoom in and zoom out |
765 |
| Zoom In |
765 |
| Zoom Out |
765 |
| Selecting a range |
766 |
| Setting the point display |
767 |
| Point Options |
767 |
| Point Colors |
768 |
| Point Markers |
769 |
| Selecting an independent variable column |
770 |
| Selecting a dependent variable column |
770 |
| Working with data and Table View |
771 |
| Defining column options |
771 |
| Changing a data set name |
774 |
| Adding a new manual column |
775 |
| Adding a calculated column |
776 |
| Creating a new data set |
779 |
| Using advanced data collection options |
779 |
| Setting up an offline sensor |
779 |
| Selecting a remote collection unit |
780 |
| Collecting remote data |
782 |
| Setting up the lab cradle for remote collection |
782 |
| Using the manual trigger to start the collection |
783 |
| Using a delay to start the collection |
784 |
| Retrieving remote data |
785 |
| Setting up Triggering |
786 |
| Setting up the sensor for triggering |
786 |
| Working with advanced analysis features |
788 |
| Replaying the data collection |
789 |
| Starting the playback |
789 |
| Pausing and resuming the playback |
789 |
| Advancing the playback by one point |
790 |
| Adjusting the playback rate and repeating the playback |
790 |
| Selecting a data set to replay |
790 |
| Striking and restoring data |
791 |
| Striking data in Graph View |
792 |
| Striking data in Table View |
793 |
| Restoring struck data |
796 |
| Adjusting derivative settings |
796 |
| Drawing a predictive plot |
797 |
| Drawing the prediction |
797 |
| Clearing the prediction |
797 |
| Using Motion Match |
798 |
| Generating a Motion Match plot |
798 |
| Removing a Motion Match plot |
798 |
| Examining graphs using Page Layout |
799 |
| Printing data views |
804 |
| Setting Print All options |
804 |
| Printing |
805 |
| Using sensors and data with other Apps |
806 |
| Collecting data in other applications |
807 |
| Opening the Sensor Console application menu |
807 |
| Opening the Sensor Console context menu |
809 |
| Viewing existing data |
810 |
| Special steps for Data and Statistics |
812 |
| Reference of Menus |
813 |
| Vernier DataQuest™ application menus |
813 |
| Sensor Console application menu options |
825 |
| Sensor Console context menu options |
826 |
| Using the TI-SmartView™ emulator |
829 |
| Opening the TI-SmartView™ emulator |
829 |
| Choosing a keypad |
831 |
| Choosing a display option |
831 |
| Changing the size of the TI-SmartView™ panel and side screen |
831 |
| Changing the width of the TI-SmartView™ panel |
831 |
| Changing the size of the screen in the workspace |
832 |
| Working with the emulated handheld |
832 |
| Using the Touchpad |
833 |
| Using the Clickpad |
833 |
| Using settings and status |
834 |
| Changing TI-SmartView™ options |
834 |
| Working with documents |
835 |
| Opening a document |
835 |
| Saving a document |
836 |
| Using Screen Capture |
836 |
| Regulatory Information |
837 |
| FCC Statement |
837 |
| USA FCC Information Concerning Radio Frequency Interference |
837 |
| Federal Communication Commission Interference Statement |
838 |
| RF Radiation Exposure and Hazard Statement: |
838 |
| Non-modification Statement: |
839 |
| Deployment Statement: |
839 |
| Canadian IC Information |
839 |
| Industry Canada Statement: |
839 |
| European Union and European Free Trade Association (EFTA) Regulatory Compliance |
839 |
| Declaration of Conformity |
840 |
| European Community Declaration of Conformity |
841 |
| Countries of Operation and Restrictions of Use in the European Community |
844 |
| Warning Statements |
844 |
| Texas Instruments Support and Service |
847 |
| For U.S. and Canada: |
847 |
| For general information |
847 |
| For product (hardware) service |
847 |
| For all other countries: |
847 |

 1
1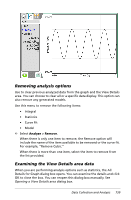 751
751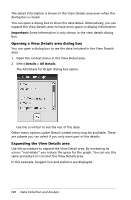 752
752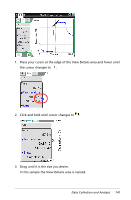 753
753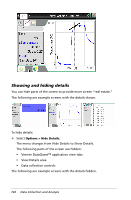 754
754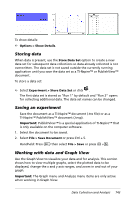 755
755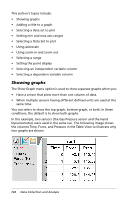 756
756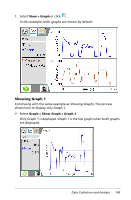 757
757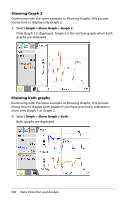 758
758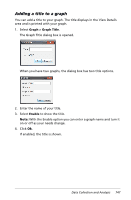 759
759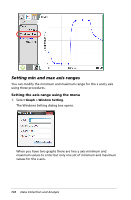 760
760 761
761

