Canon EOS 5D Mark II EOS 5D Mark II Instruction Manual - Page 130
About the Histogram, Histogram, Brightness] Display, RGB] Display
 |
UPC - 013803105384
View all Canon EOS 5D Mark II manuals
Add to My Manuals
Save this manual to your list of manuals |
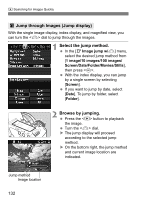
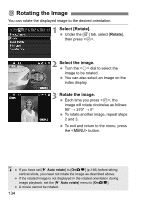
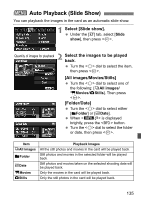
Page 130 highlights
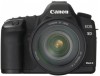
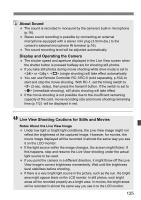
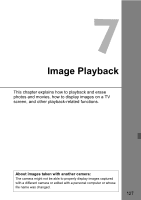
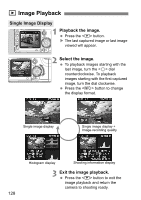
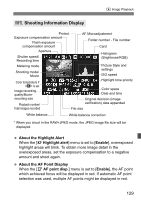
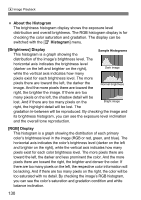
x Image Playback About the Histogram The brightness histogram display shows the exposure level distribution and overall brightness. The RGB histogram display is for checking the color saturation and gradation. The display can be switched with the [4 Histogram] menu. [Brightness] Display This histogram is a graph showing the Sample Histograms distribution of the image's brightness level. The horizontal axis indicates the brightness level (darker on the left and brighter on the right), Dark image while the vertical axis indicates how many pixels exist for each brightness level. The more pixels there are toward the left, the darker the image. And the more pixels there are toward the Normal brightness right, the brighter the image. If there are too many pixels on the left, the shadow detail will be lost. And if there are too many pixels on the Bright image right, the highlight detail will be lost. The gradation in-between will be reproduced. By checking the image and its brightness histogram, you can see the exposure level inclination and the overall tone reproduction. [RGB] Display This histogram is a graph showing the distribution of each primary color's brightness level in the image (RGB or red, green, and blue). The horizontal axis indicates the color's brightness level (darker on the left and brighter on the right), while the vertical axis indicates how many pixels exist for each color brightness level. The more pixels there are toward the left, the darker and less prominent the color. And the more pixels there are toward the right, the brighter and denser the color. If there are too many pixels on the left, the respective color information will be lacking. And if there are too many pixels on the right, the color will be too saturated with no detail. By checking the image's RGB histogram, you can see the color's saturation and gradation condition and white balance inclination. 130
-
 1
1 -
2
-
3
-
4
-
5
-
6
-
7
-
8
-
9
-
10
-
11
-
12
-
13
-
14
-
15
-
16
-
17
-
18
-
19
-
20
-
21
-
22
-
23
-
24
-
25
-
26
-
27
-
28
-
29
-
30
-
31
-
32
-
33
-
34
-
35
-
36
-
37
-
38
-
39
-
40
-
41
-
42
-
43
-
44
-
45
-
46
-
47
-
48
-
49
-
50
-
51
-
52
-
53
-
54
-
55
-
56
-
57
-
58
-
59
-
60
-
61
-
62
-
63
-
64
-
65
-
66
-
67
-
68
-
69
-
70
-
71
-
72
-
73
-
74
-
75
-
76
-
77
-
78
-
79
-
80
-
81
-
82
-
83
-
84
-
85
-
86
-
87
-
88
-
89
-
90
-
91
-
92
-
93
-
94
-
95
-
96
-
97
-
98
-
99
-
100
-
101
-
102
-
103
-
104
-
105
-
106
-
107
-
108
-
109
-
110
-
111
-
112
-
113
-
114
-
115
-
116
-
117
-
118
-
119
-
120
-
121
-
122
-
123
-
124
-
 125
125 -
 126
126 -
 127
127 -
 128
128 -
 129
129 -
 130
130 -
 131
131 -
 132
132 -
 133
133 -
 134
134 -
 135
135 -
136
-
137
-
138
-
139
-
140
-
141
-
142
-
143
-
144
-
145
-
146
-
147
-
148
-
149
-
150
-
151
-
152
-
153
-
154
-
155
-
156
-
157
-
158
-
159
-
160
-
161
-
162
-
163
-
164
-
165
-
166
-
167
-
168
-
169
-
170
-
171
-
172
-
173
-
174
-
175
-
176
-
177
-
178
-
179
-
180
-
181
-
182
-
183
-
184
-
185
-
186
-
187
-
188
-
189
-
190
-
191
-
192
-
193
-
194
-
195
-
196
-
197
-
198
-
199
-
200
-
201
-
202
-
203
-
204
-
205
-
206
-
207
-
208
-
209
-
210
-
211
-
212
-
213
-
214
-
215
-
216
-
217
-
218
-
219
-
220
-
221
-
222
-
223
-
224
-
225
-
226
-
227
-
228
 |
 |