Dell OpenManage Network Manager OpenManage Network Manager User Guide 5.2 SP1 - Page 176

Performance, Resource Groups, Resync, Traffic Analyzer, Delete, View as PDF, Show Performance

Page 176 highlights

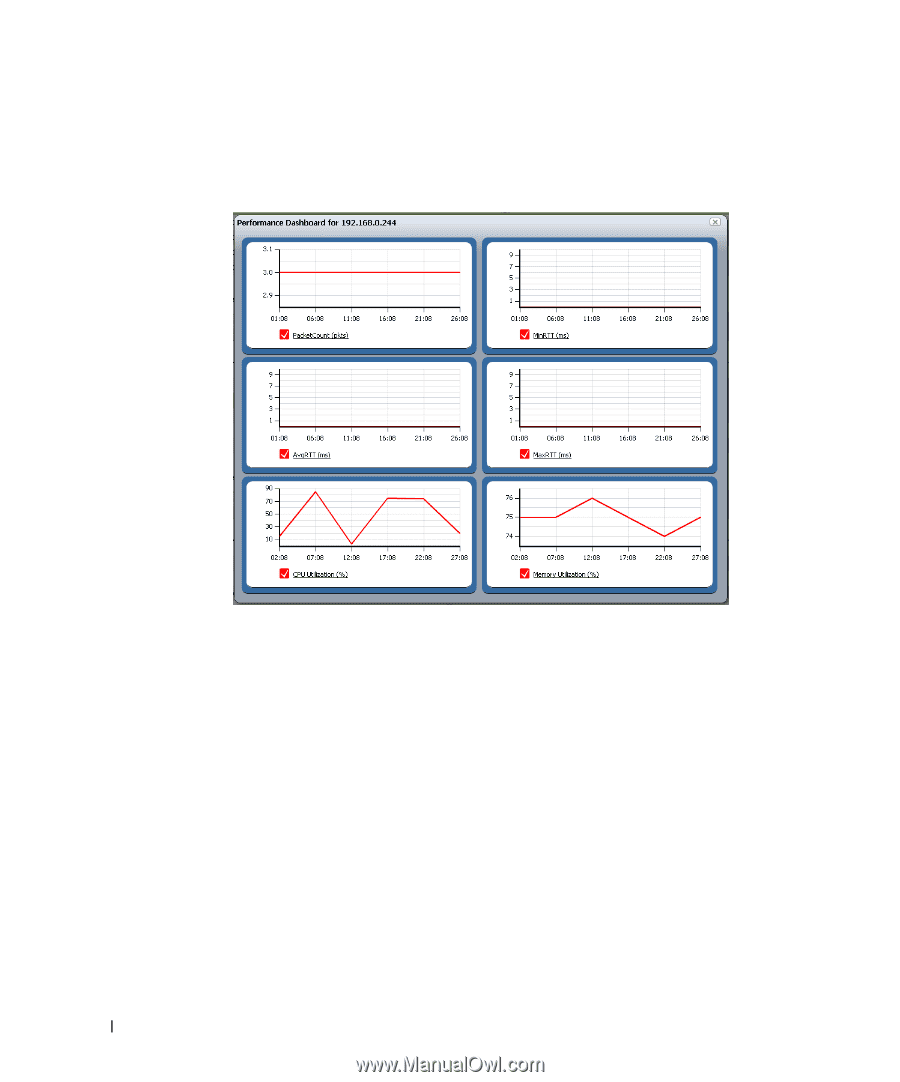
Performance-Select from the following options: Show Performance-This displays a dashboard with various performance metrics for the selected device. These can include packet counts, RTT (round-trip time) measurements, and CPU / Memory utilization graphs. See Dashboard Views on page 281 for more about re-using and managing these capabilities. Show Top Talkers-This displays a Top Talkers Dashboard of performance metrics for the selected resource. Use the icon in the top right corner to re-configure the default display. See Dashboard Views on page 281 and Top [Asset] Monitors on page 280 for more information. Show Key Metrics-This lets you see available key metrics for the selected resource, and configure their display. Resource Groups- This lets you add the selected device to new Dynamic or Static groups, or to existing groups. See for Managed Resource Groups on page 166 more about this. Resync-This re-queries the device for more current information. Traffic Analyzer-Register or Unregister the selected resource for traffic analysis. You can also select Show Traffic to see a screen with traffic for the selected device. See Chapter 8, Traffic Flow Analyzer for more about Traffic Flow. Delete- Remove the selected device from inventory. View as PDF-Displays the selected device as an Acrobat pdf. See View as PDF on page 94. 176 Managed Resources | Resource Management
  • 1
  • 2
  • 3
  • 4
  • 5
  • 6
  • 7
  • 8
  • 9
  • 10
  • 11
  • 12
  • 13
  • 14
  • 15
  • 16
  • 17
  • 18
  • 19
  • 20
  • 21
  • 22
  • 23
  • 24
  • 25
  • 26
  • 27
  • 28
  • 29
  • 30
  • 31
  • 32
  • 33
  • 34
  • 35
  • 36
  • 37
  • 38
  • 39
  • 40
  • 41
  • 42
  • 43
  • 44
  • 45
  • 46
  • 47
  • 48
  • 49
  • 50
  • 51
  • 52
  • 53
  • 54
  • 55
  • 56
  • 57
  • 58
  • 59
  • 60
  • 61
  • 62
  • 63
  • 64
  • 65
  • 66
  • 67
  • 68
  • 69
  • 70
  • 71
  • 72
  • 73
  • 74
  • 75
  • 76
  • 77
  • 78
  • 79
  • 80
  • 81
  • 82
  • 83
  • 84
  • 85
  • 86
  • 87
  • 88
  • 89
  • 90
  • 91
  • 92
  • 93
  • 94
  • 95
  • 96
  • 97
  • 98
  • 99
  • 100
  • 101
  • 102
  • 103
  • 104
  • 105
  • 106
  • 107
  • 108
  • 109
  • 110
  • 111
  • 112
  • 113
  • 114
  • 115
  • 116
  • 117
  • 118
  • 119
  • 120
  • 121
  • 122
  • 123
  • 124
  • 125
  • 126
  • 127
  • 128
  • 129
  • 130
  • 131
  • 132
  • 133
  • 134
  • 135
  • 136
  • 137
  • 138
  • 139
  • 140
  • 141
  • 142
  • 143
  • 144
  • 145
  • 146
  • 147
  • 148
  • 149
  • 150
  • 151
  • 152
  • 153
  • 154
  • 155
  • 156
  • 157
  • 158
  • 159
  • 160
  • 161
  • 162
  • 163
  • 164
  • 165
  • 166
  • 167
  • 168
  • 169
  • 170
  • 171
  • 172
  • 173
  • 174
  • 175
  • 176
  • 177
  • 178
  • 179
  • 180
  • 181
  • 182
  • 183
  • 184
  • 185
  • 186
  • 187
  • 188
  • 189
  • 190
  • 191
  • 192
  • 193
  • 194
  • 195
  • 196
  • 197
  • 198
  • 199
  • 200
  • 201
  • 202
  • 203
  • 204
  • 205
  • 206
  • 207
  • 208
  • 209
  • 210
  • 211
  • 212
  • 213
  • 214
  • 215
  • 216
  • 217
  • 218
  • 219
  • 220
  • 221
  • 222
  • 223
  • 224
  • 225
  • 226
  • 227
  • 228
  • 229
  • 230
  • 231
  • 232
  • 233
  • 234
  • 235
  • 236
  • 237
  • 238
  • 239
  • 240
  • 241
  • 242
  • 243
  • 244
  • 245
  • 246
  • 247
  • 248
  • 249
  • 250
  • 251
  • 252
  • 253
  • 254
  • 255
  • 256
  • 257
  • 258
  • 259
  • 260
  • 261
  • 262
  • 263
  • 264
  • 265
  • 266
  • 267
  • 268
  • 269
  • 270
  • 271
  • 272
  • 273
  • 274
  • 275
  • 276
  • 277
  • 278
  • 279
  • 280
  • 281
  • 282
  • 283
  • 284
  • 285
  • 286
  • 287
  • 288
  • 289
  • 290
  • 291
  • 292
  • 293
  • 294
  • 295
  • 296
  • 297
  • 298
  • 299
  • 300
  • 301
  • 302
  • 303
  • 304
  • 305
  • 306
  • 307
  • 308
  • 309
  • 310
  • 311
  • 312
  • 313
  • 314
  • 315
  • 316
  • 317
  • 318
  • 319
  • 320
  • 321
  • 322
  • 323
  • 324
  • 325
  • 326
  • 327
  • 328
  • 329
  • 330
  • 331
  • 332
  • 333
  • 334
  • 335
  • 336
  • 337
  • 338
  • 339
  • 340
  • 341
  • 342
  • 343
  • 344
  • 345
  • 346
  • 347
  • 348
  • 349
  • 350
  • 351
  • 352
  • 353
  • 354
  • 355
  • 356
  • 357
  • 358
  • 359
  • 360
  • 361
  • 362
  • 363
  • 364
  • 365
  • 366
  • 367
  • 368
  • 369
  • 370
  • 371
  • 372
  • 373
  • 374
  • 375
  • 376
  • 377
  • 378
  • 379
  • 380
  • 381
  • 382
  • 383
  • 384

176
Managed Resources | Resource Management
Performance
—Select from the following options:
Show Performance
–This displays a dashboard with various performance metrics for the
selected device. These can include packet counts, RTT (round-trip time) measure-
ments, and CPU / Memory utilization graphs.
See Dashboard Views on page 281 for more about re-using and managing these capabil-
ities.
Show Top Talkers
–This displays a
Top Talkers Dashboard
of performance metrics for the
selected resource. Use the icon in the top right corner to re-configure the default dis-
play. See Dashboard Views on page 281 and Top [Asset] Monitors on page 280 for more
information.
Show Key Metrics
–This lets you see available key metrics for the selected resource, and con-
figure their display.
Resource Groups
—This lets you add the selected device to new Dynamic or Static groups, or to
existing groups. See for Managed Resource Groups on page 166 more about this.
Resync
—This re-queries the device for more current information.
Traffic Analyzer
Register
or
Unregister
the selected resource for traffic analysis. You can also
select
Show Traffic
to see a screen with traffic for the selected device. See Chapter 8, Traffic
Flow Analyzer for more about Traffic Flow.
Delete
—Remove the selected device from inventory.
View as PDF
—Displays the selected device as an Acrobat pdf. See View as PDF on page 94.