Fluke 345 FE 345 Users Manual - Page 61
(Harmonics, is the fundamental
 |
View all Fluke 345 manuals
Add to My Manuals
Save this manual to your list of manuals |
Page 61 highlights
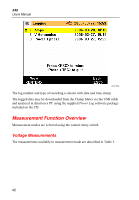
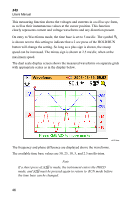
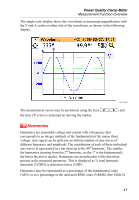
Power Quality Clamp Meter Measurement Function Overview The single scale display shows the waveforms at maximum magnification with the V and A scales at either side of the waveforms, as shown in the following display. eln31.bmp The measurement cursor may be positioned using the keys FG and the time (T=n ms) is indicated on moving the marker. LHarmonics Harmonics are sinusoidal voltage and current with a frequency that corresponds to an integer multiple of the fundamental of the mains (line) voltage. Any signal can be split into an infinite number of sine waves of different frequency and amplitude. The contribution of each of these individual sine waves is represented in a bar chart up to the 40th harmonic. The smaller the harmonics (starting from the 2nd harmonic, as the 1st is the fundamental), the better the power quality. Harmonics are an indication of the distortion present in the measured parameter. This is displayed as % total harmonic distortion (%THD) or distortion factor (%DF). Harmonics may be represented as a percentage of the fundamental value (%H1) or as a percentage of the measured RMS value (%RMS) (See Table 6). 47
-
 1
1 -
2
-
3
-
4
-
5
-
6
-
7
-
8
-
9
-
10
-
11
-
12
-
13
-
14
-
15
-
16
-
17
-
18
-
19
-
20
-
21
-
22
-
23
-
24
-
25
-
26
-
27
-
28
-
29
-
30
-
31
-
32
-
33
-
34
-
35
-
36
-
37
-
38
-
39
-
40
-
41
-
42
-
43
-
44
-
45
-
46
-
47
-
48
-
49
-
50
-
51
-
52
-
53
-
54
-
55
-
 56
56 -
 57
57 -
 58
58 -
 59
59 -
 60
60 -
 61
61 -
 62
62 -
 63
63 -
 64
64 -
 65
65 -
 66
66 -
67
-
68
-
69
-
70
-
71
-
72
-
73
-
74
-
75
-
76
-
77
-
78
-
79
-
80
 |
 |
