HP Cisco MDS 8/24c Cisco MDS 8Gb Fabric Switch for HP BladeSystem c-Class User - Page 24
Boot tasks, Interpreting LED activity, LED indicators
 |
View all HP Cisco MDS 8/24c manuals
Add to My Manuals
Save this manual to your list of manuals |
Page 24 highlights
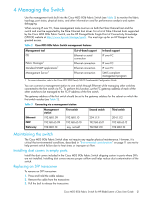
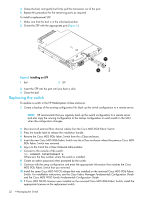
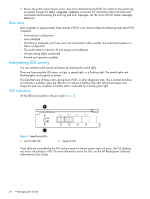
3. Review the switch system log for errors. Any errors detected during POST are written to the system log, accessible through the show logging logfile command. For information about all referenced commands and accessing the error log and error messages, see the Cisco NX-OS System Messages Reference. Boot tasks Boot completes in approximately three minutes if POST is run. Boot includes the following tasks after POST completes: • Universal port configuration • Links initialized • The fabric is analyzed, and if any ports are connected to other switches, the switch participates in a fabric configuration • The switch obtains a domain ID and assigns port addresses • Unicast routing tables constructed • Normal port operation enabled Interpreting LED activity You can monitor switch activity and status by checking the switch LEDs. There are three possible LED states: no light, a steady light, or a flashing light. The steady lights and flashing lights can be green or amber. The LEDs flash any of these colors during boot, POST, or other diagnostic tests. This is normal and does not indicate a problem unless the LEDs do not indicate a healthy state after all boot processes and diagnostic tests are complete. A healthy state is indicated by a steady green light. LED indicators All the LEDs are located on the port side (Figure 7). 1 ! EXT 1 EXT 2 EXT 3 EXT 4 199545 2 Figure 7 Identifying LEDs 1 Unit ID (UID) LED 2 Health ID LED These LEDs are controlled by the OA and are used to indicate certain types of errors. The OA displays any errors indicated by a LED. For more information about the OA, see the HP BladeSystem Onboard Administrator User Guide. 24 4 Managing the Switch
-
 1
1 -
2
-
3
-
4
-
5
-
6
-
7
-
8
-
9
-
10
-
11
-
12
-
13
-
14
-
15
-
16
-
17
-
18
-
 19
19 -
 20
20 -
 21
21 -
 22
22 -
 23
23 -
 24
24 -
 25
25 -
 26
26 -
 27
27 -
 28
28 -
 29
29 -
30
-
31
-
32
-
33
-
34
-
35
-
36
-
37
-
38
-
39
-
40
-
41
-
42
-
43
-
44
-
45
-
46
-
47
-
48
-
49
-
50
-
51
-
52
 |
 |