Sony STR-AV880 Operating Instructions - Page 7
minium
 |
View all Sony STR-AV880 manuals
Add to My Manuals
Save this manual to your list of manuals |
Page 7 highlights
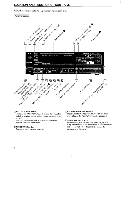
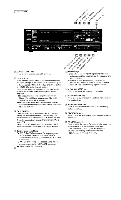
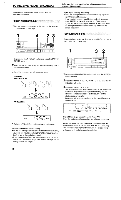
oc \.•-• 6. Display windowj .0 6\CYl c, .0 .0 cC\ ,5,_ c,q%> ° &(-`'b. • c, • \ .)ez\ro, e C.` \ ago 2G ,k• O ,y u co .c0 c0 ,e9 \L> ?se, e \
-
 1
1 -
 2
2 -
 3
3 -
 4
4 -
 5
5 -
 6
6 -
 7
7 -
 8
8 -
 9
9 -
 10
10 -
 11
11 -
 12
12 -
13
-
14
-
15
-
16
-
17
-
18
-
19
-
20
-
21
-
22
-
23
-
24
-
25
-
26
-
27
-
28
-
29
-
30
-
31
-
32
 |
 |

oc
\.•-•
.
6
%°
`b
.
•
C
.`
Display
windowj
.0 .0
.
0
c,q>
&(-'
•
c
,
0
6
727
k
\
\
CY
l
c
C\
<\&
6
o
?).
e
z
\
r
,
,5
,_
r
,
z\
>
.)
e
ag
o
2
G
c,
a§
)
,
k
•
e
,:.
6s.
.s.
0\\
O
,y
\<<
A
K!?
csr
\
e,
.
c
0
,e9
?se
,
,\•.\\
co
\.
u
\L>
\I\
<0
4x"
co
c0
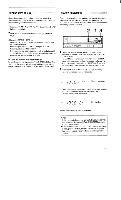
FRONT
SUBSONIC)
REAR
,!
.59
-
m6Tope
ON
=
L
.
minium
U
MID
SE
LOW
ATT
S4NA
n
Hz
O
LI
0.9
0
0.5
03
01
III
FM88
AM
9
07
0.5
3
01
90
92
94
96
98
100
102
104
106
108
MHz
600
BOO
7000
1200
1400
1600
kHz
FM
ANTENN
CATV
E
2
11
EBi
•C
.
c
,
O
(
G
.
'
4
•
()
1
.....
HI
M°
13L
N
E'2
,1
°
•
CY
7
ej
,
t>
4\
e
\C
\
\-\\'-
S
c‘
,
3
6(
6
•<<
--..\
d"
‘i"
•<
\1\
e
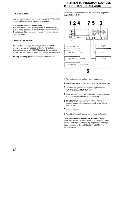
Power
output
0
SIGNAL
strength
spectrum
display
meter
100
10
=
=
1
=
=
=
0.5
=
=
= =
=
=
0.I
X
-I-
10100
400
1k
44
121,
1
2
3
4
5
LI
I
CH]
ds
*
‘;
.
c,
•
c,
•••:?'
.§
c
‘
6‘
0
cc
\
4\q'
Band/frequency
display
1
1
11
1
1
-
1
1
1
FM
I
/
I
L
1.1_1
1_I
MHz
0
Function
indicator
I/
T
ill
11
11
I
LI
1
1_1
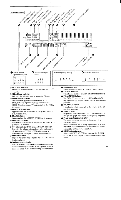
ACOUSTIC
indicator
Shows
the
number
of
the
acoustic
setting
memory,
WI
,
Wor
•
Video
2
input
indicator
Indicates
the
selected
front
or
rear
video
2
inputs.
o
Video
monitor
indicator
The
indication
appears
when
the
VIDEO
1
FUNCTION
key
is
pressed;
appears
when
the
VIDEO
2
key
is
pressed;
TV
appears
when
the
TV
key
is
pressed.
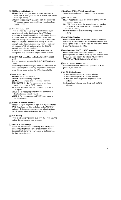
PROTECTOR
indicator
Appears
when
the
protection
circuit
against
a
short-
circuit
is
activated.
(;)
ERASE
indicator
Appears
when
the
MEMORY
ERASE
key
is
pressed.
o
FM
IF
band
indicator
The
selected
FM
IF
band
is
graphically
displayed:
(wide)
or_"_(normal).
Co
ATT
(attenuator)iSIGNAL
(signal
strength)
indicator
Normally
the
volume
attenuation
level
is
indicated
in
dB.
When
the
METER
SELECT
key
is
pressed
in
TUNER
mode,
the
signal
strength
is
indicated
in
dB.
O
FM
level
indicator
The
FM
station
level
selected
by
the
FM
LEVEL
select
key
is
displayed.
Station
spectrum
display
The
frequencies
of
the
receivable
stations
located
by
station
searching
are
shown
by
the
squares.
When
a
station
is
tuned
in,
the
corresponding
square
flashes.
O
Memory
indicator
Appears
when
the
MEMORY
PRESET
key
is
pressed.
O
Function
indicator
Indicates
the
selected
program
other
than
broadcasts.
•
FM
ANTENNA
indicator
The
CATV
appears
when
the
FM
ANT
-A
(CATV)
key
is
pressed;
M
appears
when
the
FM
ANT
-B
key
is
pressed.
•
BALANCE
indicator
Indicates
the
relative
strength
of
the
volume
at
the
left
and
right
speakers.
TONE
indicator
Graphically
shows
the
tone
control
characteristics.
A
straight
bar
graph
indicates
a
flat
frequency
response.
•
Power
output
spectrum
display
The
power
output
(in
wattage)
is
displayed
in
five
frequency
bands.
When
the
METER
SELECT
key
is
pressed,
the
"x
1/10"
indication
appears
to
indicate
that
the
scale
numbers
are
read
by
1/10
(i.e.
for
0.1,
read
0.01.)
Q
SIGNAL
strength
meter
When
the
METER
SELECT
key
is
pressed
in
TUNER
mode,
the
received
signal
strength
is
indicated
in
five
steps.
7