TP-Link T1700G-28TQ T1700G-28TQ V1 User Guide - Page 79
Traffic Statistics
 |
View all TP-Link T1700G-28TQ manuals
Add to My Manuals
Save this manual to your list of manuals |
Page 79 highlights
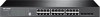
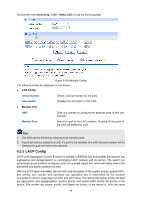
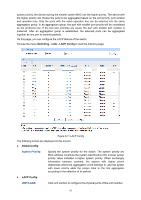
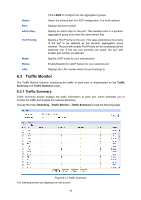
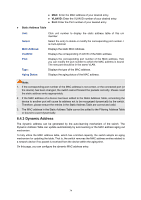
Auto Refresh Auto Refresh: Refresh Rate: Allows you to Enable/Disable refreshing the Traffic Summary automatically. Enter a value in seconds to specify the refresh interval. Traffic Summary UNIT/LAGS: Select: Port: Packets Rx: Packets Tx: Octets Rx: Octets Tx: Statistics: Click unit number to display the information of the physical ports associated with this unit member. Click LAGS to display the information of the link aggregation groups. Select the desired port for clearing. It is multi-optional. Displays the port number. Displays the number of packets received on the port. The error packets are not counted in. Displays the number of packets transmitted on the port. Displays the number of octets received on the port. The error octets are counted in. Displays the number of octets transmitted on the port. Click the Statistics button to view the detailed traffic statistics of the port. 6.3.2 Traffic Statistics Traffic Statistics screen displays the detailed traffic information of each port, which facilitates you to monitor the traffic and locate faults promptly. 69
-
 1
1 -
2
-
3
-
4
-
5
-
6
-
7
-
8
-
9
-
10
-
11
-
12
-
13
-
14
-
15
-
16
-
17
-
18
-
19
-
20
-
21
-
22
-
23
-
24
-
25
-
26
-
27
-
28
-
29
-
30
-
31
-
32
-
33
-
34
-
35
-
36
-
37
-
38
-
39
-
40
-
41
-
42
-
43
-
44
-
45
-
46
-
47
-
48
-
49
-
50
-
51
-
52
-
53
-
54
-
55
-
56
-
57
-
58
-
59
-
60
-
61
-
62
-
63
-
64
-
65
-
66
-
67
-
68
-
69
-
70
-
71
-
72
-
73
-
 74
74 -
 75
75 -
 76
76 -
 77
77 -
 78
78 -
 79
79 -
 80
80 -
 81
81 -
 82
82 -
 83
83 -
 84
84 -
85
-
86
-
87
-
88
-
89
-
90
-
91
-
92
-
93
-
94
-
95
-
96
-
97
-
98
-
99
-
100
-
101
-
102
-
103
-
104
-
105
-
106
-
107
-
108
-
109
-
110
-
111
-
112
-
113
-
114
-
115
-
116
-
117
-
118
-
119
-
120
-
121
-
122
-
123
-
124
-
125
-
126
-
127
-
128
-
129
-
130
-
131
-
132
-
133
-
134
-
135
-
136
-
137
-
138
-
139
-
140
-
141
-
142
-
143
-
144
-
145
-
146
-
147
-
148
-
149
-
150
-
151
-
152
-
153
-
154
-
155
-
156
-
157
-
158
-
159
-
160
-
161
-
162
-
163
-
164
-
165
-
166
-
167
-
168
-
169
-
170
-
171
-
172
-
173
-
174
-
175
-
176
-
177
-
178
-
179
-
180
-
181
-
182
-
183
-
184
-
185
-
186
-
187
-
188
-
189
-
190
-
191
-
192
-
193
-
194
-
195
-
196
-
197
-
198
-
199
-
200
-
201
-
202
-
203
-
204
-
205
-
206
-
207
-
208
-
209
-
210
-
211
-
212
-
213
-
214
-
215
-
216
-
217
-
218
-
219
-
220
-
221
-
222
-
223
-
224
-
225
-
226
-
227
-
228
-
229
-
230
-
231
-
232
-
233
-
234
-
235
-
236
-
237
-
238
-
239
-
240
-
241
-
242
-
243
-
244
-
245
-
246
-
247
-
248
-
249
-
250
-
251
-
252
-
253
-
254
-
255
-
256
-
257
-
258
 |
 |