ZyXEL FSG2200HNU User Guide - Page 65
Maintenance > Tools > Restart, Maintenance > System > Time Setting
 |
View all ZyXEL FSG2200HNU manuals
Add to My Manuals
Save this manual to your list of manuals |
Page 65 highlights
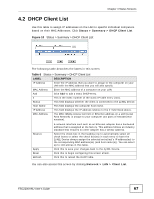
Chapter 4 Status Screens Table 5 Status LABEL DESCRIPTION System Uptime This field displays how long the ZyXEL Device has been running since it last started up. The ZyXEL Device starts up when you plug it in, when you restart it (Maintenance > Tools > Restart), or when you reset it (see Section 1.6 on page 27). Current Date/Time This field displays the current date and time in the ZyXEL Device. You can change this in Maintenance > System > Time Setting. CPU Usage This field displays what percentage of the ZyXEL Device's processing ability is currently used. When this percentage is close to 100%, the ZyXEL Device is running at full load, and the throughput is not going to improve anymore. If you want some applications to have more throughput, you should turn off other applications. Memory Usage This field displays what percentage of the ZyXEL Device's memory is currently used. Usually, this percentage should not increase much. If memory usage does get close to 100%, the ZyXEL Device is probably becoming unstable, and you should restart the device. See Section 21.4 on page 223, or turn off the device (unplug the power) for a few seconds. NAT Sessions Usage This field displays what percentage of traffic passing through the ZyXEL Device is using NAT. Interface Status Interface This column displays each interface the ZyXEL Device has. Status This field indicates whether or not the ZyXEL Device is using the interface. For the WAN interface, this field displays Up when the ZyXEL Device is using the interface and Down when the ZyXEL Device is not using the interface. For the LAN interface, this field displays Up when the ZyXEL Device is using the interface and Down when the ZyXEL Device is not using the interface. Speed For the WLAN interface, it displays Up when WLAN is enabled or Down when WLAN is disabled. For the LAN interface, this displays the port speed and duplex setting or N/A when there is no traffic on the port. For the WAN interface, this displays the port speed and duplex setting. For the WLAN interface, it displays the maximum transmission rate when WLAN is enabled or N/A when WLAN is disabled. Summary DHCP Client Click this link to view current DHCP client information. See Section 6.4 List on page 96. WLAN Client Click this link to display the MAC address(es) of the wireless stations List that are currently associating with the ZyXEL Device. See Section 4.3 on page 68. VoIP Status Click this link to view statistics about your VoIP usage. See Section 4.5 on page 70. FSG2200HNU User's Guide 65
-
 1
1 -
2
-
3
-
4
-
5
-
6
-
7
-
8
-
9
-
10
-
11
-
12
-
13
-
14
-
15
-
16
-
17
-
18
-
19
-
20
-
21
-
22
-
23
-
24
-
25
-
26
-
27
-
28
-
29
-
30
-
31
-
32
-
33
-
34
-
35
-
36
-
37
-
38
-
39
-
40
-
41
-
42
-
43
-
44
-
45
-
46
-
47
-
48
-
49
-
50
-
51
-
52
-
53
-
54
-
55
-
56
-
57
-
58
-
59
-
 60
60 -
 61
61 -
 62
62 -
 63
63 -
 64
64 -
 65
65 -
 66
66 -
 67
67 -
 68
68 -
 69
69 -
 70
70 -
71
-
72
-
73
-
74
-
75
-
76
-
77
-
78
-
79
-
80
-
81
-
82
-
83
-
84
-
85
-
86
-
87
-
88
-
89
-
90
-
91
-
92
-
93
-
94
-
95
-
96
-
97
-
98
-
99
-
100
-
101
-
102
-
103
-
104
-
105
-
106
-
107
-
108
-
109
-
110
-
111
-
112
-
113
-
114
-
115
-
116
-
117
-
118
-
119
-
120
-
121
-
122
-
123
-
124
-
125
-
126
-
127
-
128
-
129
-
130
-
131
-
132
-
133
-
134
-
135
-
136
-
137
-
138
-
139
-
140
-
141
-
142
-
143
-
144
-
145
-
146
-
147
-
148
-
149
-
150
-
151
-
152
-
153
-
154
-
155
-
156
-
157
-
158
-
159
-
160
-
161
-
162
-
163
-
164
-
165
-
166
-
167
-
168
-
169
-
170
-
171
-
172
-
173
-
174
-
175
-
176
-
177
-
178
-
179
-
180
-
181
-
182
-
183
-
184
-
185
-
186
-
187
-
188
-
189
-
190
-
191
-
192
-
193
-
194
-
195
-
196
-
197
-
198
-
199
-
200
-
201
-
202
-
203
-
204
-
205
-
206
-
207
-
208
-
209
-
210
-
211
-
212
-
213
-
214
-
215
-
216
-
217
-
218
-
219
-
220
-
221
-
222
-
223
-
224
-
225
-
226
-
227
-
228
-
229
-
230
-
231
-
232
-
233
-
234
-
235
-
236
-
237
-
238
-
239
-
240
-
241
-
242
-
243
-
244
-
245
-
246
-
247
-
248
-
249
-
250
-
251
-
252
-
253
-
254
-
255
-
256
-
257
-
258
-
259
-
260
-
261
-
262
-
263
-
264
-
265
-
266
-
267
-
268
-
269
-
270
-
271
-
272
-
273
-
274
-
275
-
276
-
277
-
278
-
279
-
280
-
281
-
282
-
283
-
284
-
285
-
286
-
287
-
288
-
289
-
290
-
291
-
292
-
293
-
294
-
295
-
296
-
297
-
298
-
299
-
300
-
301
-
302
-
303
-
304
-
305
-
306
-
307
-
308
-
309
-
310
-
311
-
312
-
313
-
314
-
315
-
316
-
317
-
318
-
319
-
320
-
321
-
322
-
323
-
324
-
325
-
326
-
327
-
328
-
329
-
330
-
331
-
332
-
333
-
334
-
335
-
336
-
337
-
338
-
339
-
340
-
341
-
342
-
343
-
344
-
345
-
346
-
347
-
348
-
349
-
350
-
351
-
352
 |
 |
