ZyXEL PLA5236 User Guide - Page 28
Packet Statistics
 |
View all ZyXEL PLA5236 manuals
Add to My Manuals
Save this manual to your list of manuals |
Page 28 highlights
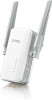
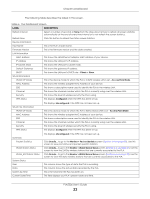
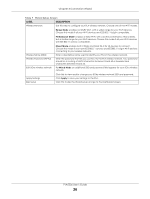
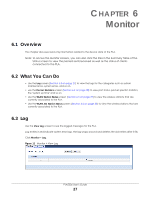
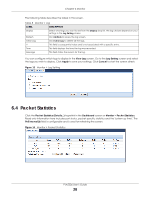
Chapter 6 Monitor The following table describes the labels in this screen. Table 8 Monitor > Log LABEL DESCRIPTION Display Select what logs you want to see from the Display drop list. The log choices depend on your settings in the Log Setting screen. Refresh Click Refresh to renew the log screen. Clear Log Click Clear Log to delete all the logs. # This field is a sequential value and is not associated with a specific entry. Time This field displays the time the log was recorded. Message This field states the reason for the log. You can configure which logs to display in the View Log screen. Go to the Log Setting screen and select the logs you wish to display. Click Apply to save your settings. Click Cancel to start the screen afresh. Figure 13 Monitor > Log Setting 6.4 Packet Statistics Click the Packet Statistics (Details...) hyperlink in the Dashboard screen or Monitor > Packet Statistics. Read-only information here includes port status, packet specific statistics and the "system up time". The Poll Interval(s) field is configurable and is used for refreshing the screen. Figure 14 Monitor > Packet Statistics PLA5236 User's Guide 28
-
 1
1 -
2
-
3
-
4
-
5
-
6
-
7
-
8
-
9
-
10
-
11
-
12
-
13
-
14
-
15
-
16
-
17
-
18
-
19
-
20
-
21
-
22
-
 23
23 -
 24
24 -
 25
25 -
 26
26 -
 27
27 -
 28
28 -
 29
29 -
 30
30 -
 31
31 -
 32
32 -
 33
33 -
34
-
35
-
36
-
37
-
38
-
39
-
40
-
41
-
42
-
43
-
44
-
45
-
46
-
47
-
48
-
49
-
50
-
51
-
52
-
53
-
54
-
55
-
56
-
57
-
58
-
59
-
60
-
61
-
62
-
63
-
64
-
65
-
66
-
67
-
68
-
69
-
70
-
71
-
72
-
73
-
74
-
75
-
76
-
77
-
78
-
79
-
80
-
81
-
82
 |
 |
