AMD AX2000DMT3C User Guide - Page 41
Electrical Data, AMD Athlon™ XP Processor Model 6 Data Sheet,
 |
View all AMD AX2000DMT3C manuals
Add to My Manuals
Save this manual to your list of manuals |
Page 41 highlights
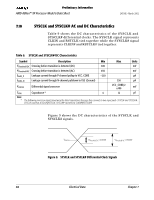
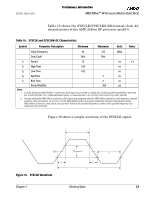
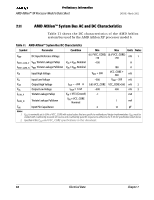
24309E-March 2002 Preliminary Information AMD Athlon™ XP Processor Model 6 Data Sheet VCC_CORE_MAX_AC Figure 8 shows the processor core voltage (VCC_CORE) waveform response to perturbation. The tMIN_AC (negative AC transient excursion time) and tMAX_AC (positive AC transient excursion time) represent the maximum allowable time below or above the DC tolerance thresholds. tmax_AC VCC_CORE_MAX_DC VCC_CORE_NOM VCC_CORE_MIN_DC VCC_CORE_MIN_AC tmin_AC ICORE_MAX ICORE_MIN dI /dt Figure 8. VCC_CORE Voltage Waveform Chapter 7 Electrical Data 29
-
 1
1 -
2
-
3
-
4
-
5
-
6
-
7
-
8
-
9
-
10
-
11
-
12
-
13
-
14
-
15
-
16
-
17
-
18
-
19
-
20
-
21
-
22
-
23
-
24
-
25
-
26
-
27
-
28
-
29
-
30
-
31
-
32
-
33
-
34
-
35
-
 36
36 -
 37
37 -
 38
38 -
 39
39 -
 40
40 -
 41
41 -
 42
42 -
 43
43 -
 44
44 -
 45
45 -
 46
46 -
47
-
48
-
49
-
50
-
51
-
52
-
53
-
54
-
55
-
56
-
57
-
58
-
59
-
60
-
61
-
62
-
63
-
64
-
65
-
66
-
67
-
68
-
69
-
70
-
71
-
72
-
73
-
74
-
75
-
76
-
77
-
78
-
79
-
80
-
81
-
82
-
83
-
84
-
85
-
86
-
87
-
88
-
89
-
90
-
91
-
92
-
93
-
94
 |
 |

Chapter 7
Electrical Data
29
24309E—March 2002
AMD Athlon™ XP Processor Model 6 Data Sheet
Preliminary Information
Figure 8
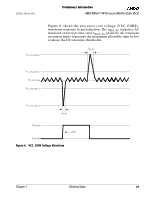
shows the processor core voltage (VCC_CORE)
waveform response to perturbation. The t
MIN_AC
(negative AC
transient excursion time) and t
MAX_AC
(positive AC transient
excursion time) represent the maximum allowable time below
or above the DC tolerance thresholds.
Figure 8.
VCC_CORE Voltage Waveform
t
min_AC
V
CC_CORE_MAX_AC
t
max_AC
V
CC_CORE_MAX_DC
V
CC_CORE_NOM
V
CC_CORE_MIN_DC
V
CC_CORE_MIN_AC
I
CORE_MIN
I
CORE_MAX
dI /dt