Compaq ProLiant 1000 I/O Performance Tuning of Compaq Servers - Page 25
Distance vs. Performance
 |
View all Compaq ProLiant 1000 manuals
Add to My Manuals
Save this manual to your list of manuals |
Page 25 highlights
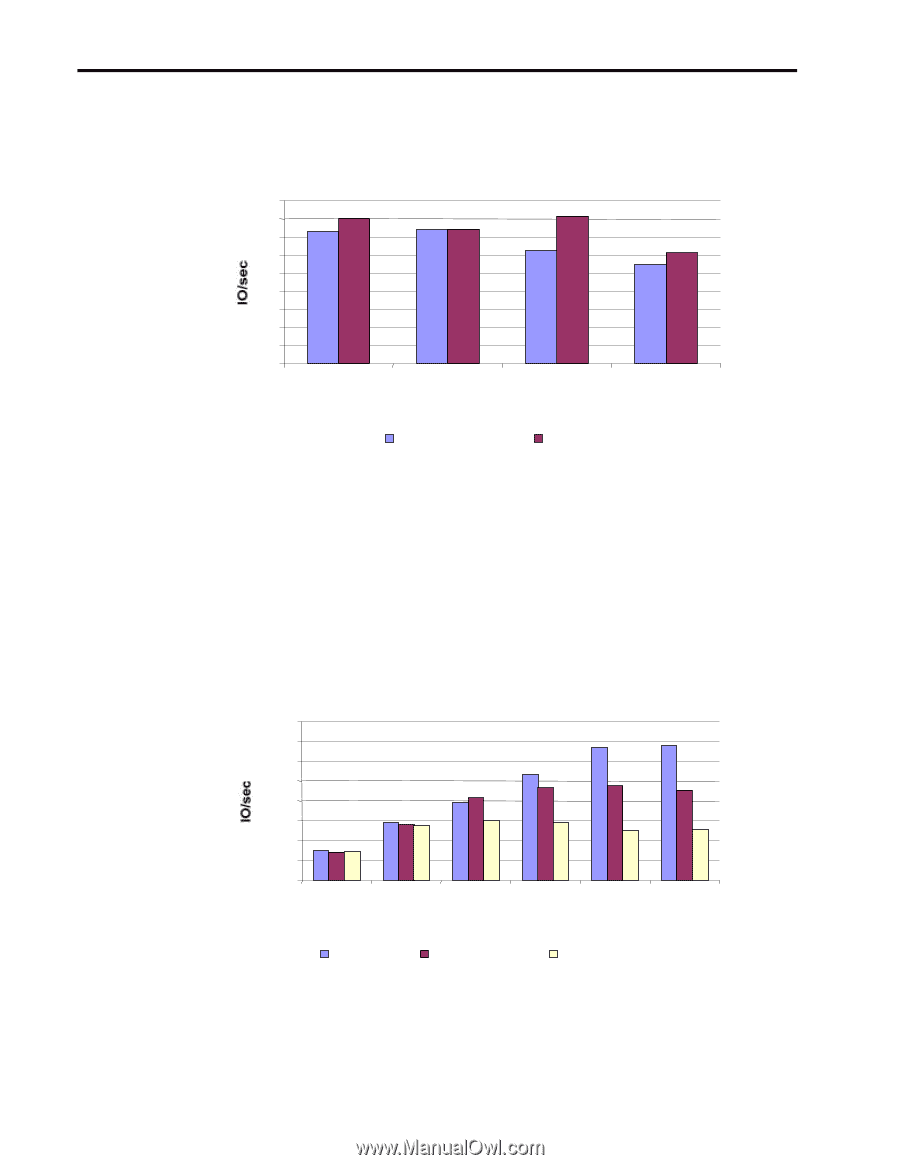
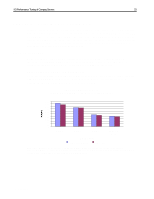
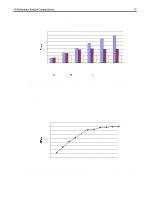
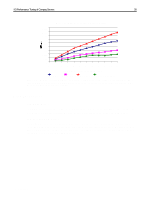
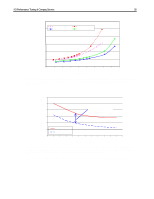
I/O Performance Tuning of Compaq Servers 25 Simulated Application: Maximum MB/sec (1 MB, 100% Read, 0% Write, 100% Sequential, 0% Random) 45 40 35 30 25 20 15 10 5 0 RAID 0 RAID 1 RAID 5 RAID 5 No Cache RAID Level Fibre Channel Array SMART-2DH Figure 10. Relative maximum throughput for SCSI and Fibre Channel storage systems. These results were obtained using Iometer version 1998.10.08, Copyright 1998 by Intel Corporation. Intel does not endorse any Iometer results. Distance vs. Performance The following graphs illustrate the impact of latency over long distances. The throughput of the 2 x 10km cable system quickly becomes limited by the latency introduced by the extended loop. In situations where remote storage is required, the performance implications should be taken into consideration. Simulated Workload: WS Mix (4 KB, 50% Read, 50% Write, 50% Sequential, 50% Random) 1600 1400 1200 1000 800 600 400 200 0 1 2 3 4 5 6 Number of Fibre Channel Arrays 5 Meter Cable 10 Kilometer Cable 2 x 10 Kilometer Cables Figure 11. Relative performance of FC-AL systems for common workstation loads. These results were obtained using Iometer version 1998.10.08, Copyright 1998 by Intel Corporation. Intel does not endorse any Iometer results. ECG044.0399
-
 1
1 -
2
-
3
-
4
-
5
-
6
-
7
-
8
-
9
-
10
-
11
-
12
-
13
-
14
-
15
-
16
-
17
-
18
-
19
-
 20
20 -
 21
21 -
 22
22 -
 23
23 -
 24
24 -
 25
25 -
 26
26 -
 27
27 -
 28
28 -
 29
29 -
 30
30 -
31
-
32
-
33
-
34
-
35
-
36
-
37
-
38
 |
 |