Compaq ProLiant 1000 I/O Performance Tuning of Compaq Servers - Page 36
Hardware RAID vs. Software RAID
 |
View all Compaq ProLiant 1000 manuals
Add to My Manuals
Save this manual to your list of manuals |
Page 36 highlights
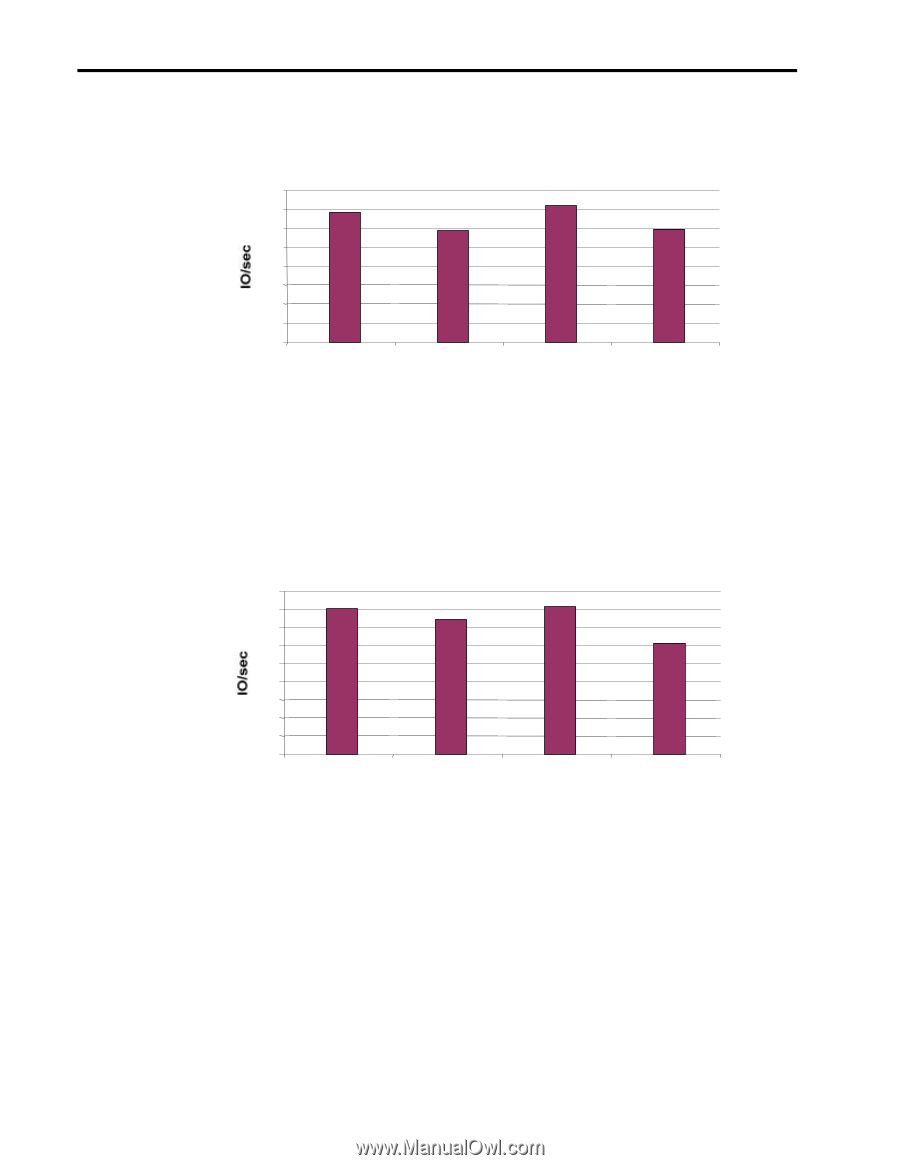
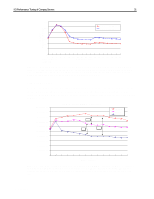
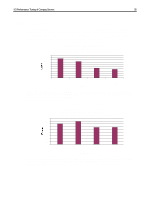
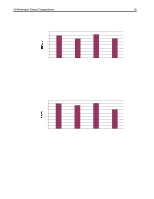
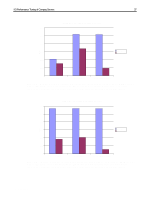
I/O Performance Tuning of Compaq Servers 36 Compaq Smart-2DH SCSI Controller Simulated Application: Video Server Read (512 KB, 100% Read, 0% Write, 100% Sequential, 0% Random) 80 70 60 50 40 30 20 10 0 RAID 0 RAID 1 RAID 5 RAID Level RAID 5 No Cache Figure 31. Relative performance of RAID levels in a video server application. These results were obtained using Iometer version 1998.10.08, Copyright 1998 by Intel Corporation. Intel does not endorse any Iometer results. Compaq Smart-2DH SCSI Controller Simulated Application: Maximum MB/sec (1 MB, 100% Read, 0% Write, 100% Sequential, 0% Random) 45 40 35 30 25 20 15 10 5 0 RAID 0 RAID 1 RAID 5 RAID Level RAID 5 No Cache Figure 32. Relative sustained maximum throughput of RAID levels. These results were obtained using Iometer version 1998.10.08, Copyright 1998 by Intel Corporation. Intel does not endorse any Iometer results. Hardware RAID vs. Software RAID Figures 34 through 35 highlight the performance benefits of a hardware RAID solution, especially when a drive in a RAID 5 array fails. ECG044.0399
-
 1
1 -
2
-
3
-
4
-
5
-
6
-
7
-
8
-
9
-
10
-
11
-
12
-
13
-
14
-
15
-
16
-
17
-
18
-
19
-
20
-
21
-
22
-
23
-
24
-
25
-
26
-
27
-
28
-
29
-
30
-
 31
31 -
 32
32 -
 33
33 -
 34
34 -
 35
35 -
 36
36 -
 37
37 -
 38
38
 |
 |