Compaq ProLiant 1000 I/O Performance Tuning of Compaq Servers - Page 34
Drive Controller Scaling
 |
View all Compaq ProLiant 1000 manuals
Add to My Manuals
Save this manual to your list of manuals |
Page 34 highlights
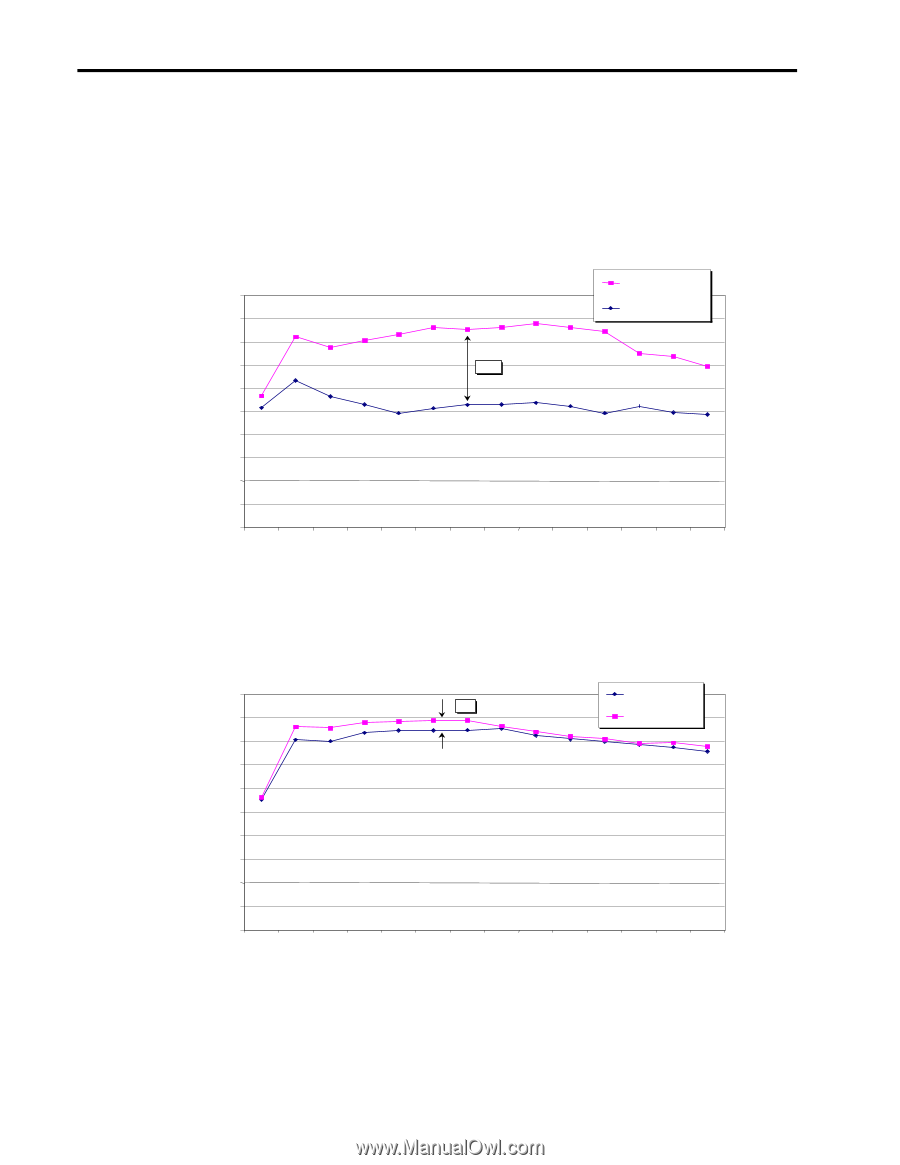
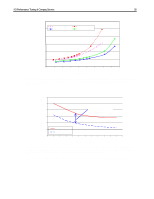
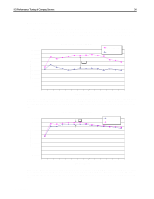
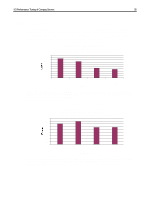
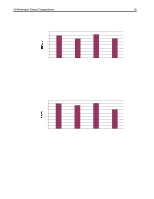
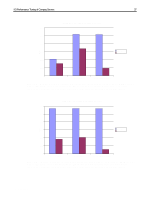
I/O Performance Tuning of Compaq Servers 34 Drive Controller Scaling Figures 27 and 28 illustrate the performance gains of distributing parity calculations by adding RAID array controllers. In Figure 29, the gains are negligible because the RAID 0 does not place a computational load on the array controller. Therefore, a single controller can handle the RAID 0 environment. Disk Controller Scaling (RAID 5) 20,000,000 18,000,000 10+2 x 4GB, 2 Ctr 11+1 x 4GB, 1 Ctr 16,000,000 Server Throughput (Bytes/sec) 14,000,000 57% 12,000,000 10,000,000 8,000,000 6,000,000 4,000,000 2,000,000 0 4 8 16 20 24 28 32 36 40 44 48 52 56 57 Number of Clients Figure 27. Drive controller scaling performance comparison in a RAID 5 environment. These results were obtained using NetBench version 5.01. Copyright 1997 by ZD Inc. All rights reserved. ZD did not independently verify this test and makes no representations or warranties as to the results of the test. Disk Controller Scaling (RAID 0) Server Throughput (Bytes/sec) 20,000,000 18,000,000 16,000,000 14,000,000 12,000,000 10,000,000 8,000,000 6,000,000 4,000,000 2,000,000 0 4 12 x 4GB, 1 Ctr 3% 12 x 4GB, 2 Ctr 8 16 20 24 28 32 36 40 44 48 52 56 57 Number of Clients Figure 28. Drive controller scaling performance comparison in a RAID 0 environment. These results were obtained using NetBench version 5.01. Copyright 1997 by ZD Inc. All rights reserved. ZD did not independently verify this test and makes no representations or warranties as to the results of the test. ECG044.0399
-
 1
1 -
2
-
3
-
4
-
5
-
6
-
7
-
8
-
9
-
10
-
11
-
12
-
13
-
14
-
15
-
16
-
17
-
18
-
19
-
20
-
21
-
22
-
23
-
24
-
25
-
26
-
27
-
28
-
 29
29 -
 30
30 -
 31
31 -
 32
32 -
 33
33 -
 34
34 -
 35
35 -
 36
36 -
 37
37 -
 38
38
 |
 |