Compaq ProLiant 1000 I/O Performance Tuning of Compaq Servers - Page 27
I/O performance vs. Number of FC Arrays
 |
View all Compaq ProLiant 1000 manuals
Add to My Manuals
Save this manual to your list of manuals |
Page 27 highlights
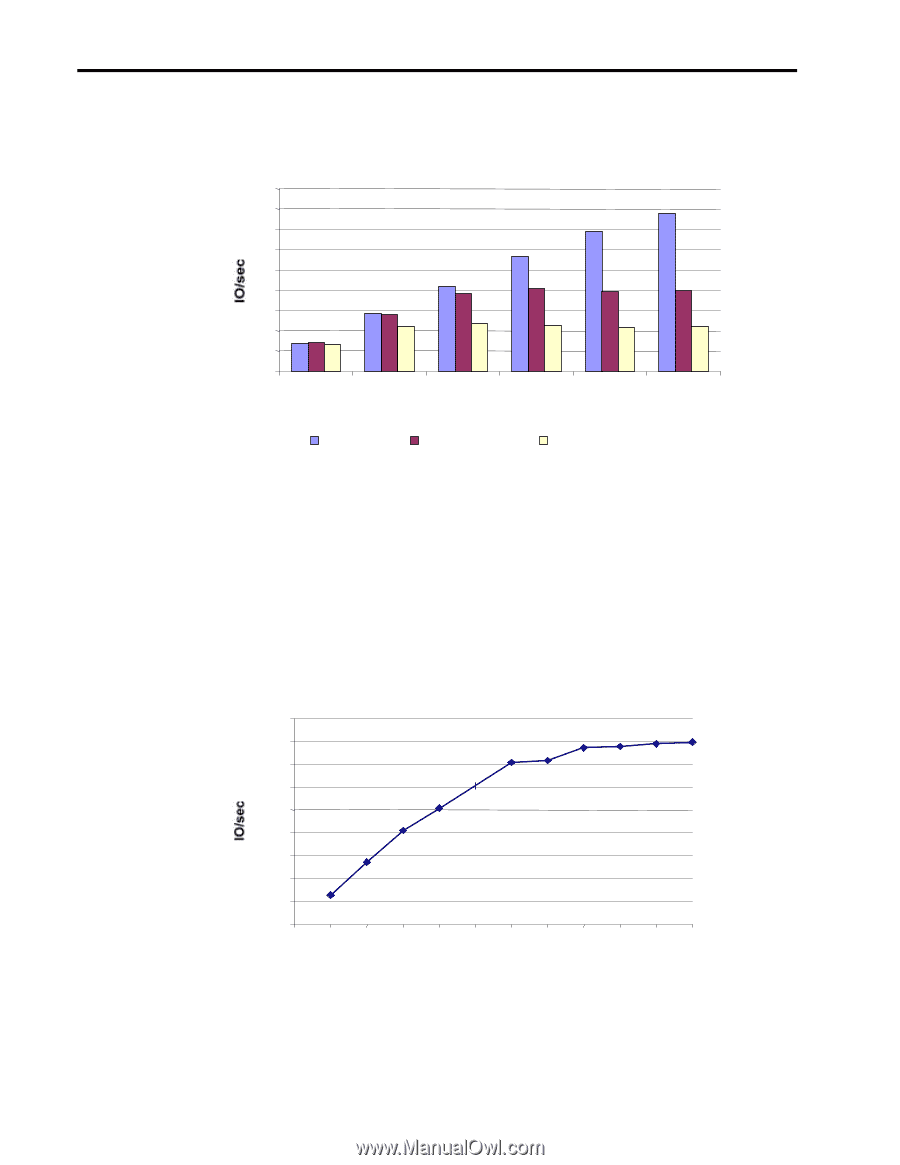
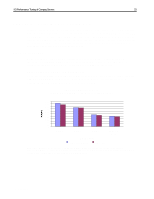
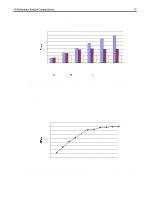
I/O Performance Tuning of Compaq Servers 27 Simulated Workload: Decision Support (25% Access, 8 KB, 0% Read, 100% Write, 100% Sequential, 0% Random 75% Access, 8 KB, 100% Read, 0% Write, 80% Sequential 20% Random) 900 800 700 600 500 400 300 200 100 0 1 2 3 4 5 6 Number of Fibre Channel Arrays 5 Meter Cable 10 Kilometer Cable 2 x 10 Kilometer Cables Figure 14. Relative performance of FC-AL systems for decision support applications. These results were obtained using Iometer version 1998.10.08, Copyright 1998 by Intel Corporation. Intel does not endorse any Iometer results. I/O performance vs. Number of FC Arrays The following graphs provide some insight into the performance gains associated with distributing the Fibre Channel storage load across multiple FC Arrays. As you can see from Figure 15 and Figure 16, performance increases across all applications with the addition of more storage arrays. IO/sec vs Number of Fibre Channel Arrays (512 B, 100% Read, 0% Write, 100% Sequential, 0% Random) 18000 16000 14000 12000 10000 8000 6000 4000 2000 0 0 1 2 3 4 5 6 7 8 9 10 11 Number of Fibre Channel Arrays Figure 15. Sustained I/O rates for Fibre Channel systems as a function of the number of attached FC arrays. These results were obtained using Iometer version 1998.10.08, Copyright 1998 by Intel Corporation. Intel does not endorse any Iometer results. ECG044.0399
-
 1
1 -
2
-
3
-
4
-
5
-
6
-
7
-
8
-
9
-
10
-
11
-
12
-
13
-
14
-
15
-
16
-
17
-
18
-
19
-
20
-
21
-
 22
22 -
 23
23 -
 24
24 -
 25
25 -
 26
26 -
 27
27 -
 28
28 -
 29
29 -
 30
30 -
 31
31 -
 32
32 -
33
-
34
-
35
-
36
-
37
-
38
 |
 |