Compaq ProLiant 1000 I/O Performance Tuning of Compaq Servers - Page 30
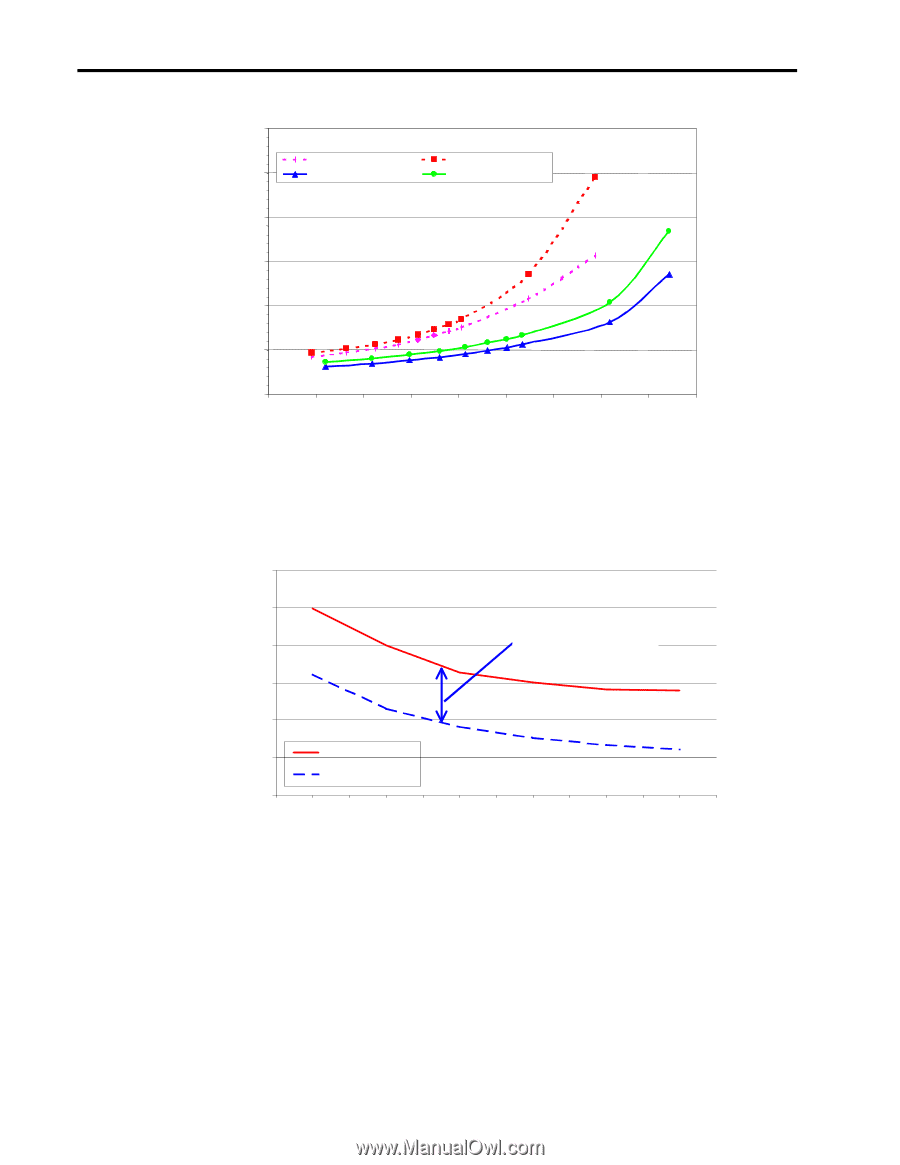
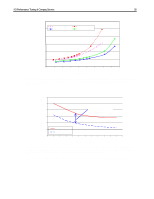
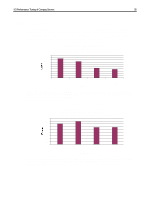
shows the expected increase in performance for 10K RPM drives when used in a RAID, array.
 |
View all Compaq ProLiant 1000 manuals
Add to My Manuals
Save this manual to your list of manuals |
Page 30 highlights
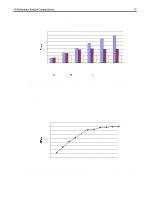
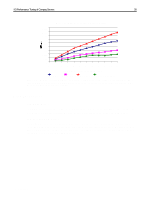
I/O Performance Tuning of Compaq Servers 30 60 Read Latency - 7,200-rpm Write Latency - 7,200-rpm 50 Read Latency - 10k-II Write Latency - 10k-II 40 Latency (ms) 30 20 10 0 0 500 1000 1500 2000 2500 3000 3500 4000 4500 I/Os per Second Figure 19. Response versus throughput for 10k and 7.2k rpm hard drives (7,200-rpm 9.1-GB versus 10k-II 9.1-GB drives. Cache disabled. 2k I/Os. 100 percent random access: 67 percent reads, 33 percent writes) 160 Throughput (Transactions per Second) 140 120 30-50% Performance Gain 100 80 60 9.1 GB 10k-II 9.1 GB 7,200-rpm 40 12 16 20 24 28 32 Number of Clients Figure 20. Single drive throughput comparison. These results were obtained using ServerBench version 4.02 Copyright 1998 by ZD Inc. All rights reserved. ZD did not independently verify this test and makes no representations or warranties as to the results of the test. Figure 21 shows the expected increase in performance for 10K RPM drives when used in a RAID array. ECG044.0399
-
 1
1 -
2
-
3
-
4
-
5
-
6
-
7
-
8
-
9
-
10
-
11
-
12
-
13
-
14
-
15
-
16
-
17
-
18
-
19
-
20
-
21
-
22
-
23
-
24
-
 25
25 -
 26
26 -
 27
27 -
 28
28 -
 29
29 -
 30
30 -
 31
31 -
 32
32 -
 33
33 -
 34
34 -
 35
35 -
36
-
37
-
38
 |
 |