Compaq ProLiant 1000 I/O Performance Tuning of Compaq Servers - Page 35
RAID Level Performance
 |
View all Compaq ProLiant 1000 manuals
Add to My Manuals
Save this manual to your list of manuals |
Page 35 highlights
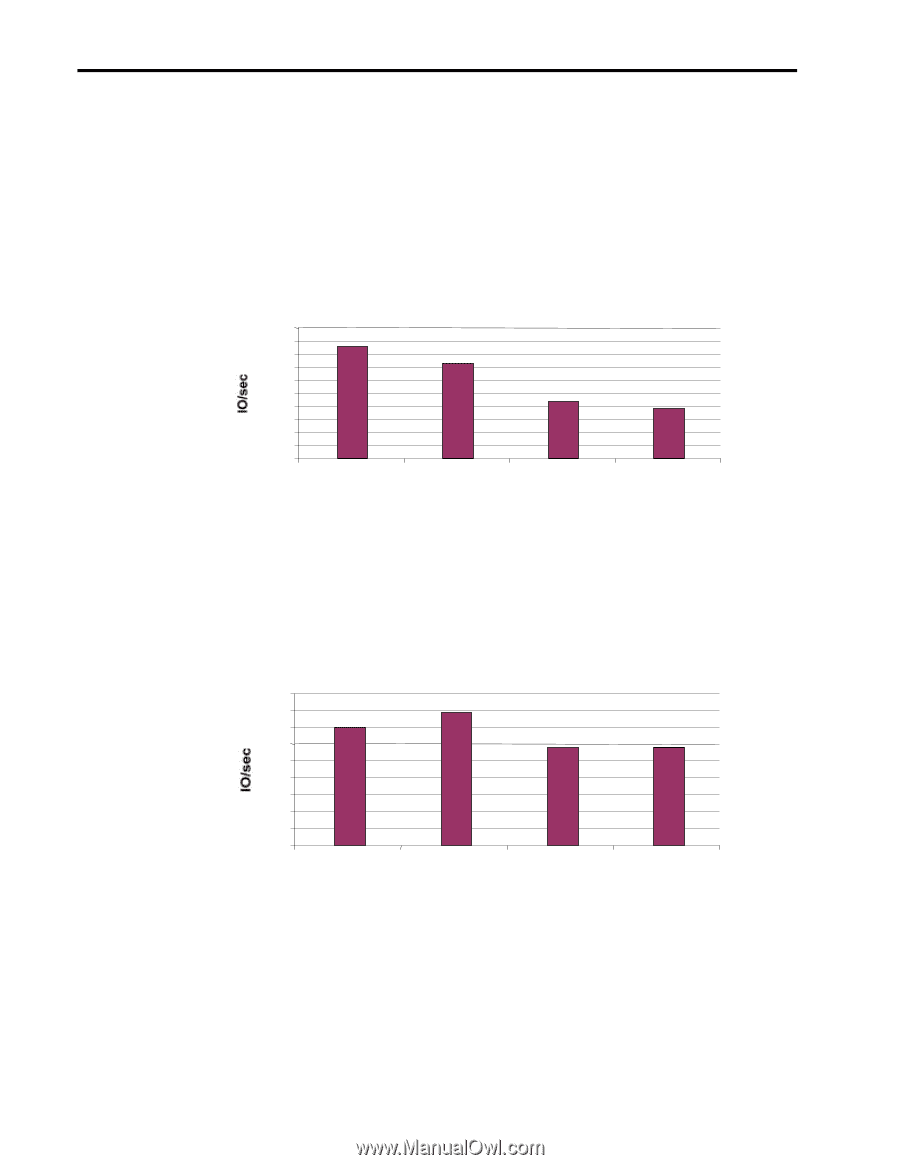
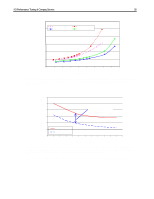
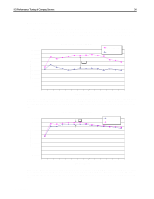
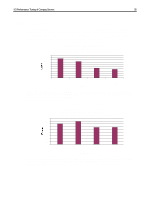
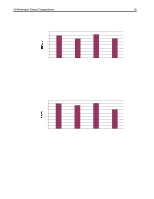
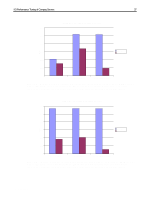
I/O Performance Tuning of Compaq Servers 35 RAID Level Performance The following 3 figures show relative performance of the various RAID levels for the SMART2DH controller for common applications. Figure 32 shows a comparison of the maximum sustained throughput for RAID 0, 1, and 5. Using these graphs you can better determine which balance of fault tolerance and speed are best for your environment. 1000 900 800 700 600 500 400 300 200 100 0 Compaq Smart-2DH SCSI Controller Simulated Application: OLTP (2 KB, 67% Read, 33% Write, 0% Sequential, 100% Random) RAID 0 RAID 1 RAID 5 RAID Level RAID 5 No Cache Figure 29. Relative performance of RAID levels in an online transaction processing application. These results were obtained using Iometer version 1998.10.08, Copyright 1998 by Intel Corporation. Intel does not endorse any Iometer results. Compaq Smart-2DH SCSI Controller Simulated Application: Web Server (8 KB, 100% Read, 0% Write, 0% Sequential, 100% Random) 900 800 700 600 500 400 300 200 100 0 RAID 0 RAID 1 RAID 5 RAID Level RAID 5 No Cache Figure 30. Relative performance of RAID levels in a web server application. These results were obtained using Iometer version 1998.10.08, Copyright 1998 by Intel Corporation. Intel does not endorse any Iometer results. ECG044.0399
-
 1
1 -
2
-
3
-
4
-
5
-
6
-
7
-
8
-
9
-
10
-
11
-
12
-
13
-
14
-
15
-
16
-
17
-
18
-
19
-
20
-
21
-
22
-
23
-
24
-
25
-
26
-
27
-
28
-
29
-
 30
30 -
 31
31 -
 32
32 -
 33
33 -
 34
34 -
 35
35 -
 36
36 -
 37
37 -
 38
38
 |
 |