Garmin fenix 2 Owner's Manual - Page 12
About VO2 Max. Estimates - 70
 |
View all Garmin fenix 2 manuals
Add to My Manuals
Save this manual to your list of manuals |
Page 12 highlights
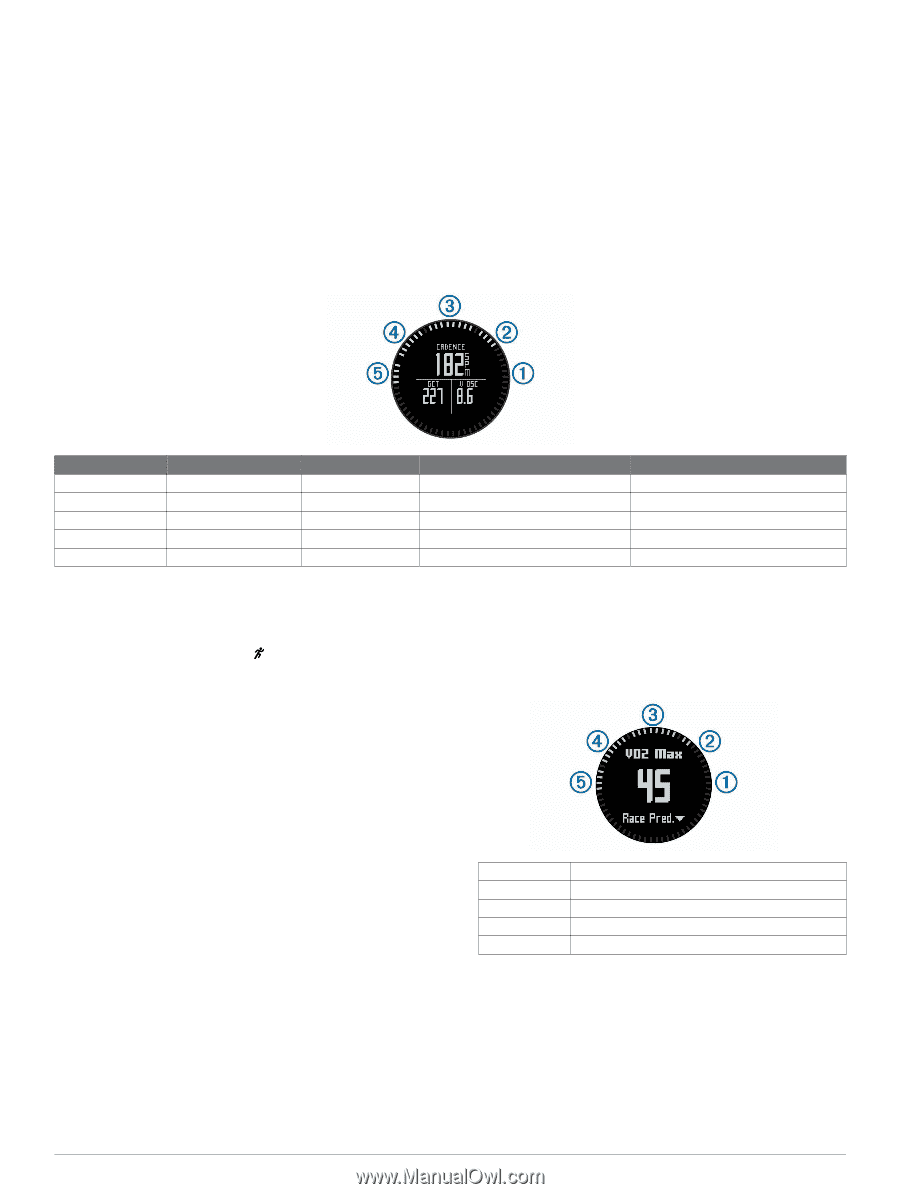
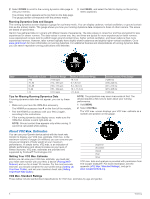
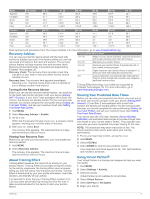
2 Select DOWN to scroll to the running dynamics data page to view your metrics. The primary metric appears as the top field on the data page. The gauge position corresponds with the primary metric. 3 Hold MENU, and select the field to display as the primary metric (optional). Running Dynamics Data and Gauges The running dynamics screen displays a gauge for a primary metric. You can display cadence, vertical oscillation, or ground contact time as the primary metric. The gauge shows you how your running dynamics data compares to those of other runners. The zones are based on percentiles. Garmin has gathered data on runners with different levels of experience. The data values in zones four and five are typical for less experienced or slower runners. The data values in zones one, two, and three are typical for more experienced or faster runners. Less experienced runners tend to exhibit longer ground contact times, higher vertical oscillation, and lower cadence than more experienced runners. However, taller runners typically have slightly slower cadences and slightly higher vertical oscillation. Go to www.garmin.com for more information on running dynamics. For additional theories and interpretations of running dynamics data, you can search reputable running publications and websites. Zone Percentile in Zone Cadence Range Vertical Oscillation Range Ground Contact Time Range >95 À >185 spm
-
 1
1 -
2
-
3
-
4
-
5
-
6
-
 7
7 -
 8
8 -
 9
9 -
 10
10 -
 11
11 -
 12
12 -
 13
13 -
 14
14 -
 15
15 -
 16
16 -
 17
17 -
18
-
19
-
20
-
21
-
22
-
23
-
24
-
25
-
26
 |
 |