HP StorageWorks 8/80 Brocade Fabric Watch Administrator's Guide v6.2.0 (53-100 - Page 80
previous selection screen., Type the number corresponding to the area that you want to con
 |
View all HP StorageWorks 8/80 manuals
Add to My Manuals
Save this manual to your list of manuals |
Page 80 highlights
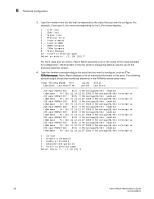
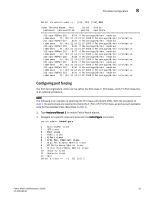
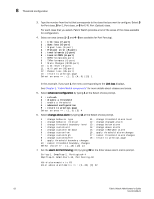
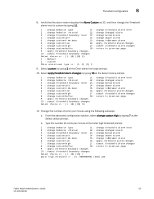
8 Threshold configuration 3. Type the number from the list that corresponds to the class that you want to configure. For example, if you type 5, the menu corresponding to the E_Port class displays. 1 : Link loss 2 : Sync loss 3 : Signal loss 4 : Protocol error 5 : Invalid words 6 : Invalid CRCS 7 : RXPerformance 8 : TXPerformance 9 : State Changes 10 : return to previous page Select an area => : (1..10) [10] 7 For each class that you select, Fabric Watch provides a list of the areas of the class available for configuration. The final item in the list, which is always the default, returns you to the previous selection screen. 4. Type the number corresponding to the area that you want to configure, such as 7 for RXPerformance. Fabric Watch displays a list of monitored elements in this area. The following sample output shows the monitored elements in the RXPerformance area menu. Index ThresholdName Port CurVal Status LastEvent LasteventTime LastVal LastState 216 eportRXPerf216 8/24 0 Percentage(%)/min enabled inBetween Fri Oct 21 14:21:01 2005 0 Percentage(%)/min Informative 217 eportRXPerf217 8/25 0 Percentage(%)/min enabled inBetween Fri Oct 21 14:21:07 2005 0 Percentage(%)/min Informative 218 eportRXPerf218 8/26 0 Percentage(%)/min enabled inBetween Fri Oct 21 14:21:07 2005 0 Percentage(%)/min Informative 219 eportRXPerf219 8/27 0 Percentage(%)/min enabled inBetween Fri Oct 21 14:21:07 2005 0 Percentage(%)/min Informative 220 eportRXPerf220 8/28 0 Percentage(%)/min enabled inBetween Fri Oct 21 14:21:07 2005 0 Percentage(%)/min Informative 221 eportRXPerf221 8/29 0 Percentage(%)/min enabled inBetween Fri Oct 21 14:21:07 2005 0 Percentage(%)/min Informative 222 eportRXPerf222 8/30 0 Percentage(%)/min enabled inBetween Fri Oct 21 14:21:07 2005 0 Percentage(%)/min Informative 223 eportRXPerf223 8/31 0 Percentage(%)/min enabled inBetween Fri Oct 21 14:21:07 2005 0 Percentage(%)/min Informative 1 : refresh 2 : disable a threshold 3 : enable a threshold 4 : advanced configuration 5 : return to previous page Select choice => : (1..5) [5] 1 58 Fabric Watch Administrator's Guide 53-1001188-01
-
 1
1 -
2
-
3
-
4
-
5
-
6
-
7
-
8
-
9
-
10
-
11
-
12
-
13
-
14
-
15
-
16
-
17
-
18
-
19
-
20
-
21
-
22
-
23
-
24
-
25
-
26
-
27
-
28
-
29
-
30
-
31
-
32
-
33
-
34
-
35
-
36
-
37
-
38
-
39
-
40
-
41
-
42
-
43
-
44
-
45
-
46
-
47
-
48
-
49
-
50
-
51
-
52
-
53
-
54
-
55
-
56
-
57
-
58
-
59
-
60
-
61
-
62
-
63
-
64
-
65
-
66
-
67
-
68
-
69
-
70
-
71
-
72
-
73
-
74
-
 75
75 -
 76
76 -
 77
77 -
 78
78 -
 79
79 -
 80
80 -
 81
81 -
 82
82 -
 83
83 -
 84
84 -
 85
85 -
86
-
87
-
88
-
89
-
90
-
91
-
92
-
93
-
94
-
95
-
96
-
97
-
98
-
99
-
100
-
101
-
102
-
103
-
104
-
105
-
106
-
107
-
108
-
109
-
110
-
111
-
112
-
113
-
114
-
115
-
116
-
117
-
118
 |
 |