Motorola MC3090G Integration Guide - Page 210
Imager Decode Ranges, A - 8, MC3000 Integrator Guide
 |
View all Motorola MC3090G manuals
Add to My Manuals
Save this manual to your list of manuals |
Page 210 highlights
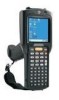
A - 8 MC3000 Integrator Guide Imager Decode Ranges The decode ranges provide the decode distances for barcodes of specified densities. Figure A-3 shows the imager decode ranges and Table A-5 on page A-9 lists the scan ranges for the selected bar code densities. The minimum element width (or "symbol density") is the width in mils of the narrowest element (bar or space) in the symbol. The maximum usable length of a symbol at any given range is shown below. in. cm 6 15.24 Note: Typical performance at 73˚ F (23˚ C) on high quality symbols. MC3000 5 mil 4.5 6.5 PDF417 6.67 mil 5.3 7.7 3.3 4.3 2.5 3.8 2.8 7.5 mil PDF417 10 mil UPC A 10.7 11.1 PDF417 15 mil 20 mil 14.2 14.4 5 12.7 4 10.16 3 7.62 2 5.08 W i d 1 2.54 t h o 0 0 f 1 2.54 F i e 2 5.08 l d 3 7.62 4 10.16 18.9 5 12.7 6 15.24 in. 0 cm 0 5 10 15 20 12.7 25.4 38.1 50.8 Depth of Field Figure A-3 MC3000 Imager Decode Ranges
-
 1
1 -
2
-
3
-
4
-
5
-
6
-
7
-
8
-
9
-
10
-
11
-
12
-
13
-
14
-
15
-
16
-
17
-
18
-
19
-
20
-
21
-
22
-
23
-
24
-
25
-
26
-
27
-
28
-
29
-
30
-
31
-
32
-
33
-
34
-
35
-
36
-
37
-
38
-
39
-
40
-
41
-
42
-
43
-
44
-
45
-
46
-
47
-
48
-
49
-
50
-
51
-
52
-
53
-
54
-
55
-
56
-
57
-
58
-
59
-
60
-
61
-
62
-
63
-
64
-
65
-
66
-
67
-
68
-
69
-
70
-
71
-
72
-
73
-
74
-
75
-
76
-
77
-
78
-
79
-
80
-
81
-
82
-
83
-
84
-
85
-
86
-
87
-
88
-
89
-
90
-
91
-
92
-
93
-
94
-
95
-
96
-
97
-
98
-
99
-
100
-
101
-
102
-
103
-
104
-
105
-
106
-
107
-
108
-
109
-
110
-
111
-
112
-
113
-
114
-
115
-
116
-
117
-
118
-
119
-
120
-
121
-
122
-
123
-
124
-
125
-
126
-
127
-
128
-
129
-
130
-
131
-
132
-
133
-
134
-
135
-
136
-
137
-
138
-
139
-
140
-
141
-
142
-
143
-
144
-
145
-
146
-
147
-
148
-
149
-
150
-
151
-
152
-
153
-
154
-
155
-
156
-
157
-
158
-
159
-
160
-
161
-
162
-
163
-
164
-
165
-
166
-
167
-
168
-
169
-
170
-
171
-
172
-
173
-
174
-
175
-
176
-
177
-
178
-
179
-
180
-
181
-
182
-
183
-
184
-
185
-
186
-
187
-
188
-
189
-
190
-
191
-
192
-
193
-
194
-
195
-
196
-
197
-
198
-
199
-
200
-
201
-
202
-
203
-
204
-
 205
205 -
 206
206 -
 207
207 -
 208
208 -
 209
209 -
 210
210 -
 211
211 -
 212
212 -
 213
213 -
 214
214 -
 215
215 -
216
-
217
-
218
-
219
-
220
-
221
-
222
-
223
-
224
-
225
-
226
-
227
-
228
-
229
-
230
-
231
-
232
-
233
-
234
-
235
-
236
 |
 |
