Netgear WGR614v9 WGR614v9 User Manual - Page 85
Viewing a List of Attached Devices, Poll Interval, Set Interval, Attached, Devices - update
 |
View all Netgear WGR614v9 manuals
Add to My Manuals
Save this manual to your list of manuals |
Page 85 highlights
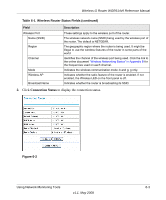
Wireless-G Router WGR614v9 Reference Manual Table 6-3 describes the router statistics. Table 6-3. Router Statistics Item System Up Time Port Status TxPkts RxPkts Collisions Tx B/s Rx B/s Up Time Poll Interval Description The time elapsed since the router was last restarted. The statistics for the WAN (Internet) and LAN (Ethernet) ports. For each port, the screen displays the following: The link status of the port. The number of packets transmitted on this port since reset or manual clear. The number of packets received on this port since reset or manual clear. The number of collisions on this port since reset or manual clear. The current transmission (outbound) bandwidth used on the WAN and LAN ports. The current reception (inbound) bandwidth used on the WAN and LAN ports. The time elapsed since this port acquired the link. The intervals at which the statistics are updated in this screen. To change the polling frequency, enter a time in seconds in the Poll Interval field, and click Set Interval. To stop the polling entirely, click Stop. Viewing a List of Attached Devices The Attached Devices screen contains a table of all IP devices that the router has discovered on the local network. From the main menu of the browser interface, under Maintenance, select Attached Devices to view the table. Figure 6-4 Using Network Monitoring Tools 6-5 v1.1, May 2008
-
 1
1 -
2
-
3
-
4
-
5
-
6
-
7
-
8
-
9
-
10
-
11
-
12
-
13
-
14
-
15
-
16
-
17
-
18
-
19
-
20
-
21
-
22
-
23
-
24
-
25
-
26
-
27
-
28
-
29
-
30
-
31
-
32
-
33
-
34
-
35
-
36
-
37
-
38
-
39
-
40
-
41
-
42
-
43
-
44
-
45
-
46
-
47
-
48
-
49
-
50
-
51
-
52
-
53
-
54
-
55
-
56
-
57
-
58
-
59
-
60
-
61
-
62
-
63
-
64
-
65
-
66
-
67
-
68
-
69
-
70
-
71
-
72
-
73
-
74
-
75
-
76
-
77
-
78
-
79
-
 80
80 -
 81
81 -
 82
82 -
 83
83 -
 84
84 -
 85
85 -
 86
86 -
 87
87 -
 88
88 -
 89
89 -
 90
90 -
91
-
92
-
93
-
94
-
95
-
96
-
97
-
98
-
99
-
100
-
101
-
102
-
103
-
104
-
105
-
106
-
107
-
108
-
109
-
110
-
111
-
112
-
113
-
114
-
115
-
116
 |
 |
