Nokia 9300 User Guide - Page 48
Creating and modifying chart sheets, List of functions, Sheets/ Charts
 |
UPC - 890552608553
View all Nokia 9300 manuals
Add to My Manuals
Save this manual to your list of manuals |
Page 48 highlights
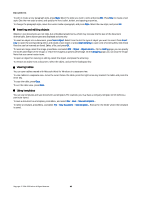
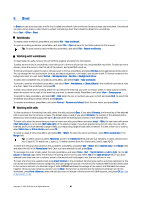
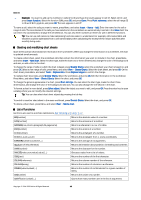
Sheet Example: You want to add up the numbers in cells C2 to C6 and have the results appear in cell C7. Select cell C7, and press Insert function. Select the function SUM, press OK, and press Done. Press Point reference, select the cell range C2 to C6 with Shift+joystick, and press OK. The sum appears in cell C7. To name a cell, select the cells you want to name, press Menu, and select Insert > Name > Add. Enter the name for the cell or range of cells. The coordinates of the cells you have selected on the worksheet are automatically inserted in the Value field. You can enter new coordinates to change the cell selection. You can also enter numbers or letters for use in different functions. Tip: You can use cell names to make calculating functions easier to understand. For example, cells named Rent and Groceries could be subtracted from a cell named Salary when calculating the money left for leisure activities after monthly living costs. Creating and modifying chart sheets Chart sheets contain charts based on information from worksheets. When you change the information on a worksheet, the chart is updated simultaneously. To create a chart sheet, select the worksheet cells that contain the information you want to include in the chart, press Menu, and select Insert > New chart. Select the chart type, make the chart two or three-dimensional, change the color of the background and axis, or add a title to the chart. To change the range of cells on which the chart is based, press Sheets/ Charts, select the worksheet your chart is based on, and press OK. Select a new range of cells, press Menu, and select View > Sheets/Charts. Select the chart sheet, and press OK. On the chart sheet, press Menu, and select Tools > Replace data. Press Replace ranges to confirm the change. To replace chart sheet data, press Sheets/ Charts. Select the worksheet, and press OK. Edit the information in the worksheet. Press Menu, and select View > Sheets/Charts. Select the chart, and press OK. To change the general appearance of a chart, press Chart settings. You can select the chart type, make the chart threedimensional, and change the color of the background and axis. You can also change the title shown in the chart. To format a chart in more detail, press Select object. Select the object you want to edit, and press OK. Press the enter key to open a dialog where you can modify the relevant settings. Tip: You can also select chart sheet objects by pressing the tab key. To switch to another chart sheet in the same workbook, press Sheets/ Charts. Select the chart, and press OK. To delete a chart sheet, press Menu, and select Chart > Delete chart. List of functions Functions are used to automate calculations. See "Working with cells," p. 47. ABS(number) Returns the absolute value of a number. ACOS(number) Returns the arccosine of a number. ADDRESS(row,column,paragraph,A1,pagename) Returns a reference to a row of a table. ASIN(number) Returns the arcsine of a number. ATAN(number) Returns the arctangent of a number. ATAN2 (x_num,y_num) Returns the arctangent from x- and y-coordinates. AVERAGE(number1,number2,...) Returns the average of its arguments. CELL(type of info,reference) Returns information about position, formatting and contents. CHAR(number) Returns the character for the number. CHOOSE(index_num,value1,value2,...) Chooses a value from a list of values. CODE(text) Returns the number of the first character. COLUMN(reference) Returns the column number of the reference. COLUMNS(array) Returns the number of columns in a reference. COMBIN(value1,value2,...) Returns the number of combinations for a given number of items. COS(number) Returns the cosine of a number. COUNT(value1,value2,...) Counts how many numbers are in the list of arguments. Copyright © 2004-2005 Nokia. All Rights Reserved. 48
-
 1
1 -
2
-
3
-
4
-
5
-
6
-
7
-
8
-
9
-
10
-
11
-
12
-
13
-
14
-
15
-
16
-
17
-
18
-
19
-
20
-
21
-
22
-
23
-
24
-
25
-
26
-
27
-
28
-
29
-
30
-
31
-
32
-
33
-
34
-
35
-
36
-
37
-
38
-
39
-
40
-
41
-
42
-
 43
43 -
 44
44 -
 45
45 -
 46
46 -
 47
47 -
 48
48 -
 49
49 -
 50
50 -
 51
51 -
 52
52 -
 53
53 -
54
-
55
-
56
-
57
-
58
-
59
-
60
-
61
-
62
-
63
-
64
-
65
-
66
-
67
-
68
-
69
-
70
-
71
-
72
-
73
-
74
-
75
-
76
-
77
-
78
-
79
-
80
-
81
-
82
-
83
-
84
-
85
-
86
-
87
-
88
-
89
-
90
-
91
-
92
-
93
-
94
-
95
-
96
-
97
-
98
-
99
-
100
-
101
-
102
-
103
 |
 |