Cisco 7940 Administration Guide - Page 105
Stack Statistics, Status Messages
 |
UPC - 746320773858
View all Cisco 7940 manuals
Add to My Manuals
Save this manual to your list of manuals |
Page 105 highlights
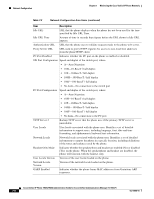
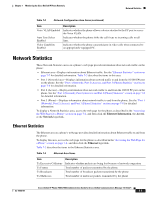
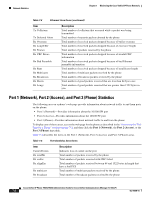
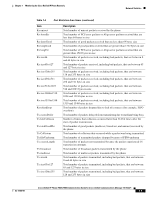
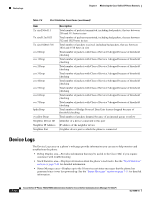
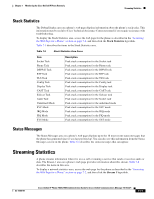
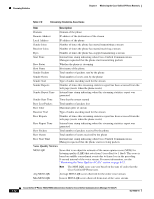
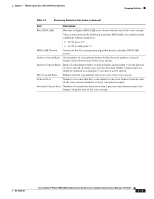
Chapter 7 Monitoring the Cisco Unified IP Phone Remotely Streaming Statistics Stack Statistics The Debug Display area on a phone's web page displays information about the phone's stack tasks. This information may be useful to Cisco Technical Assistance Center personnel if you require assistance with troubleshooting. To display the Stack Statistics area, access the web page for the phone as described in the "Accessing the Web Page for a Phone" section on page 7-2, and then click the Stack Statistics hyperlink. Table 7-5 describes the items in the Stack Statistics area. Table 7-5 Stack Statistics Area Items Item Socket Task Phone Task DSPPoll Task RTP Task TLS Task Config Task Display Task CAST Task Sidecar Task Audit Task Undefined Mode SVC Mode IRQ Mode FIQ Mode SYS Mode Description Peak stack consumption for the Socket task Peak stack consumption for the Phone task Peak stack consumption for the DPPoll task Peak stack consumption for the RTP task Peak stack consumption for the TLS task Peak stack consumption for the Config task Peak stack consumption for the Display task Peak stack consumption for the CAST task Peak stack consumption for the Sidecar task Peak stack consumption for the Socket task Peak stack consumption for the undefined mode Peak stack consumption for the SVC mode Peak stack consumption for the IRQ mode Peak stack consumption for the FIQ mode Peak stack consumption for the SYS mode Status Messages The Status Messages area on a phone's web page displays up to the 10 most recent status messages that the phone has generated since it was last powered up. You can also see this information from the Status Messages screen on the phone. Table 6-1 describes the status messages that can appear. Streaming Statistics A phone streams information when it is on a a call or running a service that sends or receives audio or data. The Stream 1 area on a phone's web page provides information about this stream. Table 7-6 describes the items in this area. To display a network statistics area, access the web page for the phone as described in the "Accessing the Web Page for a Phone" section on page 7-2, and then click the Stream 1 hyperlink. OL-15498-01 Cisco Unified IP Phone 7960G/7940G Administration Guide for Cisco Unified Communications Manager 7.0 (SCCP) 7-11
-
 1
1 -
2
-
3
-
4
-
5
-
6
-
7
-
8
-
9
-
10
-
11
-
12
-
13
-
14
-
15
-
16
-
17
-
18
-
19
-
20
-
21
-
22
-
23
-
24
-
25
-
26
-
27
-
28
-
29
-
30
-
31
-
32
-
33
-
34
-
35
-
36
-
37
-
38
-
39
-
40
-
41
-
42
-
43
-
44
-
45
-
46
-
47
-
48
-
49
-
50
-
51
-
52
-
53
-
54
-
55
-
56
-
57
-
58
-
59
-
60
-
61
-
62
-
63
-
64
-
65
-
66
-
67
-
68
-
69
-
70
-
71
-
72
-
73
-
74
-
75
-
76
-
77
-
78
-
79
-
80
-
81
-
82
-
83
-
84
-
85
-
86
-
87
-
88
-
89
-
90
-
91
-
92
-
93
-
94
-
95
-
96
-
97
-
98
-
99
-
 100
100 -
 101
101 -
 102
102 -
 103
103 -
 104
104 -
 105
105 -
 106
106 -
 107
107 -
 108
108 -
 109
109 -
 110
110 -
111
-
112
-
113
-
114
-
115
-
116
-
117
-
118
-
119
-
120
-
121
-
122
-
123
-
124
-
125
-
126
-
127
-
128
-
129
-
130
-
131
-
132
-
133
-
134
-
135
-
136
-
137
-
138
-
139
-
140
-
141
-
142
-
143
-
144
-
145
-
146
-
147
-
148
-
149
-
150
-
151
-
152
-
153
-
154
-
155
-
156
-
157
-
158
-
159
-
160
-
161
-
162
 |
 |
