Dell PowerEdge M610 Web Tools Administrator’s Guide - Page 138
For the Brocade 48000, Brocade DCX and Brocade DCX 4S enterprise-class platforms
 |
View all Dell PowerEdge M610 manuals
Add to My Manuals
Save this manual to your list of manuals |
Page 138 highlights
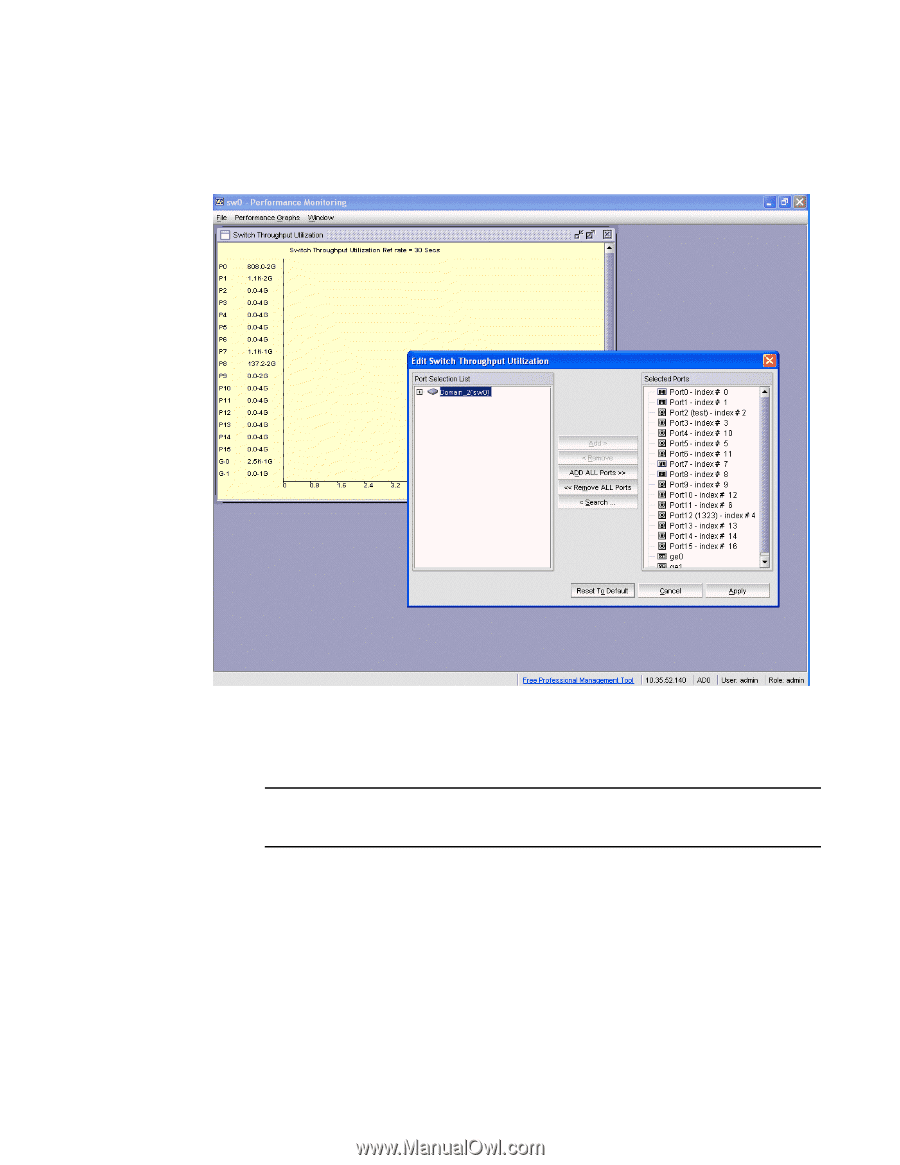
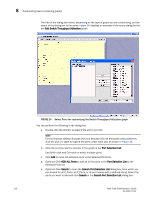
DRAFT: BROCADE CONFIDENTIAL 8 Customizing basic monitoring graphs The title of the dialog box varies, depending on the type of graph you are customizing, but the layout of the dialog box is the same. Figure 36 displays an example of the setup dialog box for the Edit Switch Throughput Utilization graph. FIGURE 36 Select Ports for customizing the Switch Throughput Utilization graph You can perform the following in the dialog box: a. Double-click the domain to expand the slot or port list. NOTE For the Brocade 48000, Brocade DCX and Brocade DCX 4S enterprise-class platforms, click the plus (+) signs to expand the ports under each slot, as shown in Figure 36. b. Click the port you want to monitor in the graph in the Port Selection List. Use Shift+click and Ctrl+click to select multiple ports. c. Click Add to move the selected ports to the Selected Ports list. d. Optional: Click ADD ALL Ports to add all of the ports in the Port Selection List to the Selected Ports list. e. Optional: Click Search to open the Search Port Selection List dialog box, from which you can search for all E_Ports, all F_Ports, or all port names with a defined string. Select the ports you want to add and click Search in the Search Port Selection List dialog box. 110 Web Tools Administrator's Guide 53-1001772-01
-
 1
1 -
2
-
3
-
4
-
5
-
6
-
7
-
8
-
9
-
10
-
11
-
12
-
13
-
14
-
15
-
16
-
17
-
18
-
19
-
20
-
21
-
22
-
23
-
24
-
25
-
26
-
27
-
28
-
29
-
30
-
31
-
32
-
33
-
34
-
35
-
36
-
37
-
38
-
39
-
40
-
41
-
42
-
43
-
44
-
45
-
46
-
47
-
48
-
49
-
50
-
51
-
52
-
53
-
54
-
55
-
56
-
57
-
58
-
59
-
60
-
61
-
62
-
63
-
64
-
65
-
66
-
67
-
68
-
69
-
70
-
71
-
72
-
73
-
74
-
75
-
76
-
77
-
78
-
79
-
80
-
81
-
82
-
83
-
84
-
85
-
86
-
87
-
88
-
89
-
90
-
91
-
92
-
93
-
94
-
95
-
96
-
97
-
98
-
99
-
100
-
101
-
102
-
103
-
104
-
105
-
106
-
107
-
108
-
109
-
110
-
111
-
112
-
113
-
114
-
115
-
116
-
117
-
118
-
119
-
120
-
121
-
122
-
123
-
124
-
125
-
126
-
127
-
128
-
129
-
130
-
131
-
132
-
 133
133 -
 134
134 -
 135
135 -
 136
136 -
 137
137 -
 138
138 -
 139
139 -
 140
140 -
 141
141 -
 142
142 -
 143
143 -
144
-
145
-
146
-
147
-
148
-
149
-
150
-
151
-
152
-
153
-
154
-
155
-
156
-
157
-
158
-
159
-
160
-
161
-
162
-
163
-
164
-
165
-
166
-
167
-
168
-
169
-
170
-
171
-
172
-
173
-
174
-
175
-
176
-
177
-
178
-
179
-
180
-
181
-
182
-
183
-
184
-
185
-
186
-
187
-
188
-
189
-
190
-
191
-
192
-
193
-
194
-
195
-
196
-
197
-
198
-
199
-
200
-
201
-
202
-
203
-
204
-
205
-
206
-
207
-
208
-
209
-
210
-
211
-
212
-
213
-
214
-
215
-
216
-
217
-
218
-
219
-
220
-
221
-
222
-
223
-
224
-
225
-
226
-
227
-
228
-
229
-
230
-
231
-
232
-
233
-
234
-
235
-
236
-
237
-
238
-
239
-
240
-
241
-
242
-
243
-
244
-
245
-
246
-
247
-
248
-
249
-
250
-
251
-
252
-
253
-
254
-
255
-
256
-
257
-
258
-
259
-
260
-
261
-
262
-
263
-
264
-
265
-
266
-
267
-
268
-
269
-
270
-
271
-
272
-
273
-
274
-
275
-
276
-
277
-
278
-
279
-
280
-
281
-
282
-
283
-
284
-
285
-
286
-
287
-
288
-
289
-
290
-
291
-
292
-
293
-
294
-
295
-
296
-
297
-
298
-
299
-
300
-
301
-
302
-
303
-
304
-
305
-
306
-
307
-
308
-
309
-
310
 |
 |