HP F2219AA#ABA HP 20b Business Consultant Financial Calculator Manual - Page 61
The Data and Stats Menus, Weight, Predictions
 |
UPC - 088358587534
View all HP F2219AA#ABA manuals
Add to My Manuals
Save this manual to your list of manuals |
Page 61 highlights
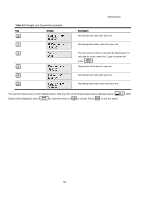
Statistical Operations The Data and Stats Menus :y :z Statistics analysis functions are located in the Data and Statistics menus accessible with the and keys. See Figure 1 for assistance with navigating through the menus. :y Press to open the Data menu. In this menu, enter a list of x values for one-variable statistics, a list of pairs, (x, F) for weighted, one-variable statistics, a list of numbers x for one-variable statistics, or a list of pairs, (x, y) for two-variable I statistics. To enter data, key in a number and press . :z Press to analyze the data. If you attempt to open the Statistics (Stats) menu before entering data, you will be I redirected to the Data menu. When opened, the Stats menu displays 2 Vars for two-variable statistics. Press repeatedly to select the type of statistical operations desired, two-variable, (2 Vars ), one-variable, (1 Var ), or one-variable weighted (1 Weight ). < > I After selecting the type of statistical operation you want, select a sub-menu by pressing or , and press to < > open it. Once in a sub-menu, press or repeatedly to view the results. To return from the sub-menu to the Statistics menu, press :z. Note: in one-variable modes, there are no items for y and the Predictions sub-menu is not available. I Pressing with the Predictions sub-menu displayed opens a sub-menu, in which you can choose among six different types of regression lines. See Figure 1. To select a specific type of regression line in the Predictions sub-menu, press I = to cycle through the options. Note: if you press , the calculator automatically selects the curve that is the best fit for your data. < Once you select a regression line, press to see the regression line parameters and perform predictions. 61
-
 1
1 -
2
-
3
-
4
-
5
-
6
-
7
-
8
-
9
-
10
-
11
-
12
-
13
-
14
-
15
-
16
-
17
-
18
-
19
-
20
-
21
-
22
-
23
-
24
-
25
-
26
-
27
-
28
-
29
-
30
-
31
-
32
-
33
-
34
-
35
-
36
-
37
-
38
-
39
-
40
-
41
-
42
-
43
-
44
-
45
-
46
-
47
-
48
-
49
-
50
-
51
-
52
-
53
-
54
-
55
-
 56
56 -
 57
57 -
 58
58 -
 59
59 -
 60
60 -
 61
61 -
 62
62 -
 63
63 -
 64
64 -
 65
65 -
 66
66 -
67
-
68
-
69
-
70
-
71
-
72
-
73
-
74
-
75
 |
 |
