HP F2219AA#ABA HP 20b Business Consultant Financial Calculator Manual - Page 64
a*X+b, Table 10-3
 |
UPC - 088358587534
View all HP F2219AA#ABA manuals
Add to My Manuals
Save this manual to your list of manuals |
Page 64 highlights
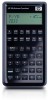
Table 10-3 Statistics Example Keys 5I1 70I Display Statistical Operations Description Inputs values for X(5) and Y(5). :z Opens Stats menu.
-
 1
1 -
2
-
3
-
4
-
5
-
6
-
7
-
8
-
9
-
10
-
11
-
12
-
13
-
14
-
15
-
16
-
17
-
18
-
19
-
20
-
21
-
22
-
23
-
24
-
25
-
26
-
27
-
28
-
29
-
30
-
31
-
32
-
33
-
34
-
35
-
36
-
37
-
38
-
39
-
40
-
41
-
42
-
43
-
44
-
45
-
46
-
47
-
48
-
49
-
50
-
51
-
52
-
53
-
54
-
55
-
56
-
57
-
58
-
 59
59 -
 60
60 -
 61
61 -
 62
62 -
 63
63 -
 64
64 -
 65
65 -
 66
66 -
 67
67 -
 68
68 -
 69
69 -
70
-
71
-
72
-
73
-
74
-
75
 |
 |
Statistical Operations
64
Table 10-3
Statistics Example
Keys
Display
Description
5I1
70I
Inputs values for X(5) and Y(5).
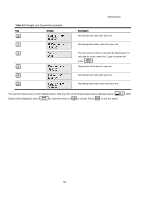
:z
Opens Stats menu.
<I
Opens Descriptive sub-menu.
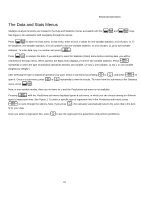
<<
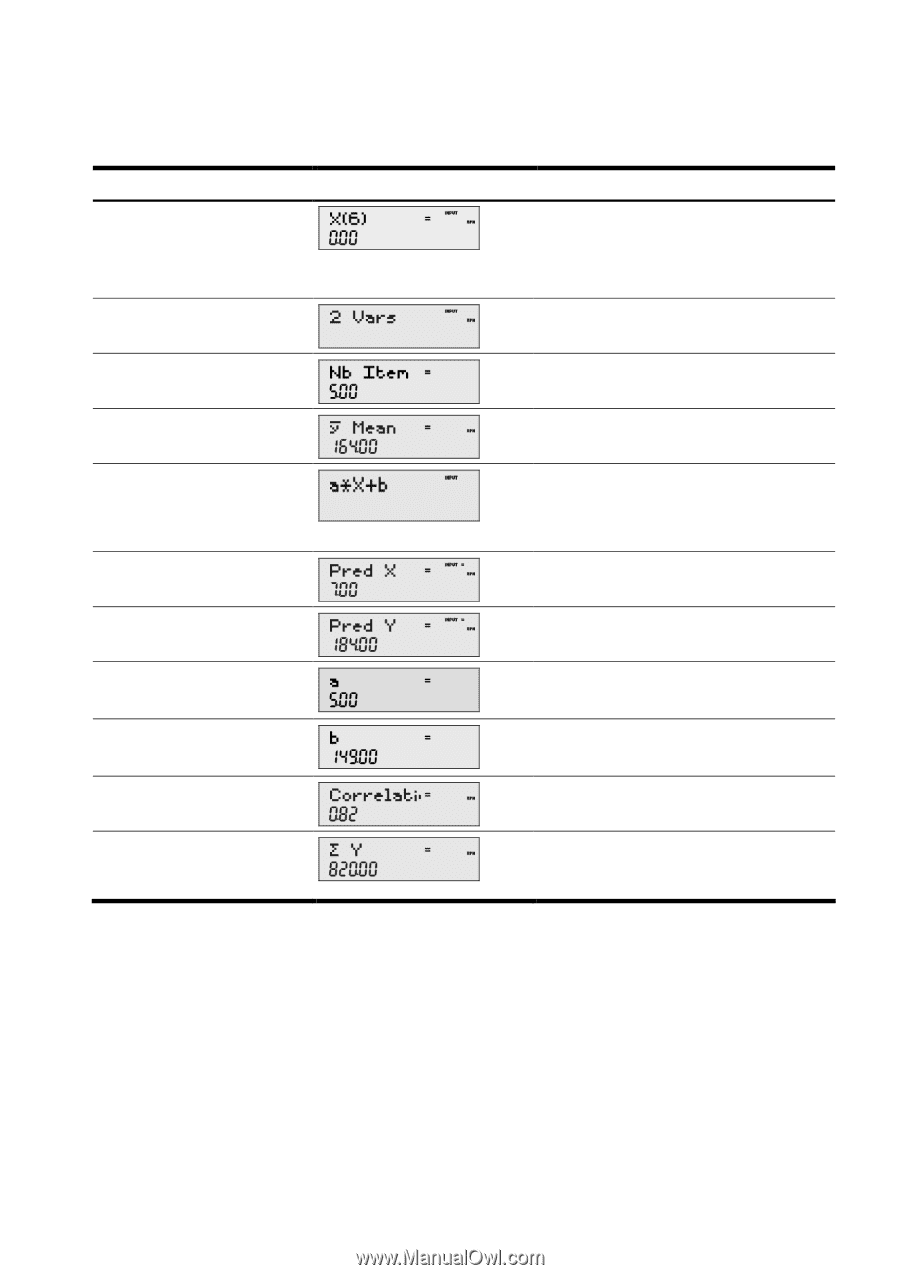
Displays average
y
.
:z<<
I
Opens Predictions sub-menu. Note: this example
performs calculations based on a linear
(a*X+b)
regression line.
<7I
Inputs
7
as the
Prediction X
value (month 7).
<=
Calculates
Prediction Y
value (sales at month 7).
<
Displays value for
a
: the slope of the regression
line.
<
Displays current value for
b
: the y-intercept of the
regression line.
<
Displays value for
Correlation
.
:z<<
<I<
Opens
Sums
sub-menu. Displays the sum of all y
values (Sigma Y).
To reset the menu items to their default values, with any item of the Data or Statistics menus displayed press
:x
. At
the prompt,
Stats
, press
I
.
Confirm your choice by pressing
I
.