HP F2219AA#ABA HP 20b Business Consultant Financial Calculator Manual - Page 63
Statistics Example, Table 10-1
 |
UPC - 088358587534
View all HP F2219AA#ABA manuals
Add to My Manuals
Save this manual to your list of manuals |
Page 63 highlights
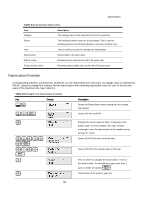
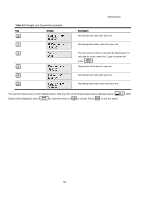
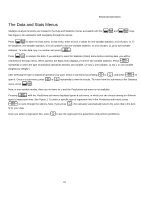
Statistical Operations Table 10-1 The Statistics Menu Items Menu Item Description Sigma Y The sum of the y values. Sigma X2 The sum of the squares of the x values. Sigma Y2 The sum of the squares for the y values. Sigma XY The sum of the products of the x and y values. Statistics Example Sales for the last five months are represented by the pairs of values shown below, with the month number as x, and the sales values as y. Enter these into the Data menu. Using the Statistics menu for Predictions, predict sales for month seven. What is the linear regression line? What is the sum of all the y values? See Tables 10-2 and 10-3. Table 10-2 Months and Sales Month 1 Sales Values 150 2 165 3 160 4 175 5 170 Table 10-3 Statistics Example Keys :y Display 1I1 50I 2I1 65I 3I1 60I 4I1 75I 63 Description Opens Data menu. Inputs values for X(1) and Y(1). Inputs values for X(2) and Y(2). Inputs values for X(3) and Y(3). Inputs values for X(4) and Y(4).
-
 1
1 -
2
-
3
-
4
-
5
-
6
-
7
-
8
-
9
-
10
-
11
-
12
-
13
-
14
-
15
-
16
-
17
-
18
-
19
-
20
-
21
-
22
-
23
-
24
-
25
-
26
-
27
-
28
-
29
-
30
-
31
-
32
-
33
-
34
-
35
-
36
-
37
-
38
-
39
-
40
-
41
-
42
-
43
-
44
-
45
-
46
-
47
-
48
-
49
-
50
-
51
-
52
-
53
-
54
-
55
-
56
-
57
-
 58
58 -
 59
59 -
 60
60 -
 61
61 -
 62
62 -
 63
63 -
 64
64 -
 65
65 -
 66
66 -
 67
67 -
 68
68 -
69
-
70
-
71
-
72
-
73
-
74
-
75
 |
 |