Lowrance Elite-12 Ti Operator Manual EN - Page 41
Easy View, Photo overlay, Photo transparency
 |
View all Lowrance Elite-12 Ti manuals
Add to My Manuals
Save this manual to your list of manuals |
Page 41 highlights
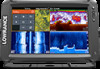
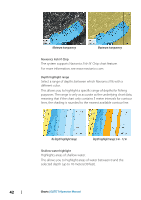
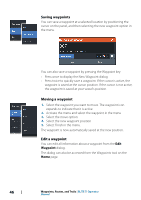
Current speed The arrow length depends on the rate, and the symbol is rotated according to flow direction. Flow rate is shown inside the arrow symbol. The red symbol is used when current speed is increasing, and the blue symbol is used when current speed is decreasing. Tide height The gauge has 8 labels and is set according to absolute max/min value of the evaluated day. The red arrow is used when tide is rising, and the blue arrow is used when tide is falling. Ú Note: All numeric values are shown in the relevant system units (unit of measurement) set by user. Easy View Magnifying feature that increases the size of chart items and text. Ú Note: There is no indication on the chart showing that this feature is active. Photo overlay Photo overlay enables you to view satellite photo images of an area as an overlay on the chart. The availability of such photos is limited to certain regions, and cartography versions. You can view photo overlays in either 2D or 3D modes. No Photo overlay Photo overlay, land only Full Photo overlay Photo transparency The Photo transparency sets the opaqueness of the photo overlay. With minimum transparency settings the chart details are almost hidden by the photo. Charts | ELITE Ti Operator Manual 41
-
 1
1 -
2
-
3
-
4
-
5
-
6
-
7
-
8
-
9
-
10
-
11
-
12
-
13
-
14
-
15
-
16
-
17
-
18
-
19
-
20
-
21
-
22
-
23
-
24
-
25
-
26
-
27
-
28
-
29
-
30
-
31
-
32
-
33
-
34
-
35
-
 36
36 -
 37
37 -
 38
38 -
 39
39 -
 40
40 -
 41
41 -
 42
42 -
 43
43 -
 44
44 -
 45
45 -
 46
46 -
47
-
48
-
49
-
50
-
51
-
52
-
53
-
54
-
55
-
56
-
57
-
58
-
59
-
60
-
61
-
62
-
63
-
64
-
65
-
66
-
67
-
68
-
69
-
70
-
71
-
72
-
73
-
74
-
75
-
76
-
77
-
78
-
79
-
80
-
81
-
82
-
83
-
84
-
85
-
86
-
87
-
88
-
89
-
90
-
91
-
92
-
93
-
94
-
95
-
96
-
97
-
98
-
99
-
100
-
101
-
102
-
103
-
104
-
105
-
106
-
107
-
108
-
109
-
110
-
111
-
112
-
113
-
114
-
115
-
116
-
117
-
118
-
119
-
120
-
121
-
122
-
123
-
124
-
125
-
126
-
127
-
128
-
129
-
130
 |
 |
