Lowrance Elite-12 Ti Operator Manual EN - Page 65
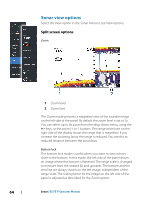
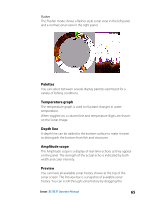
Flasher, Palettes, Temperature graph, Depth line, Amplitude scope, Preview
 |
View all Lowrance Elite-12 Ti manuals
Add to My Manuals
Save this manual to your list of manuals |
Page 65 highlights
Flasher The Flasher mode shows a flasher-style sonar view in the left panel and a normal sonar view in the right panel. Palettes You can select between several display palettes optimized for a variety of fishing conditions. Temperature graph The temperature graph is used to illustrate changes in water temperature. When toggled on, a colored line and temperature digits are shown on the Sonar image. Depth line A depth line can be added to the bottom surface to make it easier to distinguish the bottom from fish and structures. Amplitude scope The Amplitude scope is a display of real-time echoes as they appear on the panel. The strength of the actual echo is indicated by both width and color intensity. Preview You can have all available sonar history shown at the top of the sonar screen. The Preview bar is a snapshot of available sonar history. You can scroll through sonar history by dragging the Sonar | ELITE Ti Operator Manual 65
-
 1
1 -
2
-
3
-
4
-
5
-
6
-
7
-
8
-
9
-
10
-
11
-
12
-
13
-
14
-
15
-
16
-
17
-
18
-
19
-
20
-
21
-
22
-
23
-
24
-
25
-
26
-
27
-
28
-
29
-
30
-
31
-
32
-
33
-
34
-
35
-
36
-
37
-
38
-
39
-
40
-
41
-
42
-
43
-
44
-
45
-
46
-
47
-
48
-
49
-
50
-
51
-
52
-
53
-
54
-
55
-
56
-
57
-
58
-
59
-
 60
60 -
 61
61 -
 62
62 -
 63
63 -
 64
64 -
 65
65 -
 66
66 -
 67
67 -
 68
68 -
 69
69 -
 70
70 -
71
-
72
-
73
-
74
-
75
-
76
-
77
-
78
-
79
-
80
-
81
-
82
-
83
-
84
-
85
-
86
-
87
-
88
-
89
-
90
-
91
-
92
-
93
-
94
-
95
-
96
-
97
-
98
-
99
-
100
-
101
-
102
-
103
-
104
-
105
-
106
-
107
-
108
-
109
-
110
-
111
-
112
-
113
-
114
-
115
-
116
-
117
-
118
-
119
-
120
-
121
-
122
-
123
-
124
-
125
-
126
-
127
-
128
-
129
-
130
 |
 |
