Texas Instruments TI-80 User Manual - Page 103
Displaying the Table
 |
View all Texas Instruments TI-80 manuals
Add to My Manuals
Save this manual to your list of manuals |
Page 103 highlights
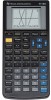
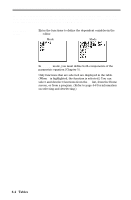
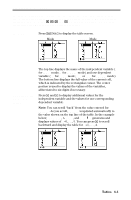
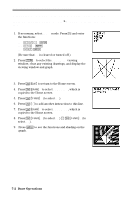
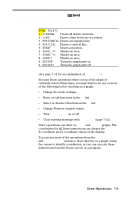
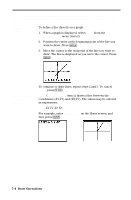
Displaying the Table The table displays up to six values for the independent variable, along with the six corresponding values of one dependent variable, at a time. Once the table is displayed, you can press 6, 7, 9, and 8 to move around and scroll the table, displaying other independent and dependent values. The Table Press 2 & to display the table screen. FUNC Mode PARAM Mode Displaying More Independent Values The top line displays the name of the independent variable (X for FUNC mode; T for PARAM mode) and one dependent variable (Yn for FUNC mode; XnT or YnT for PARAM mode). The bottom line displays the full value of the current cell, which is indicated by the rectangular cursor. The center portion is used to display the values of the variables, abbreviated to six digits if necessary. Press 7 and 8 to display additional values for the independent variable and the values for one corresponding dependent variable. Note: You can scroll "back" from the value entered for TBLMIN. As you scroll, TBLMIN is updated automatically to the value shown on the top line of the table. In the example below, TBLMIN=0, @TBL=1, and Y1=Xñ+2 generates and displays values of X=0, . . ., 5. You can press 7 to scroll backward and display the table for X=1, . . . ,4. Tables 6-5
-
 1
1 -
2
-
3
-
4
-
5
-
6
-
7
-
8
-
9
-
10
-
11
-
12
-
13
-
14
-
15
-
16
-
17
-
18
-
19
-
20
-
21
-
22
-
23
-
24
-
25
-
26
-
27
-
28
-
29
-
30
-
31
-
32
-
33
-
34
-
35
-
36
-
37
-
38
-
39
-
40
-
41
-
42
-
43
-
44
-
45
-
46
-
47
-
48
-
49
-
50
-
51
-
52
-
53
-
54
-
55
-
56
-
57
-
58
-
59
-
60
-
61
-
62
-
63
-
64
-
65
-
66
-
67
-
68
-
69
-
70
-
71
-
72
-
73
-
74
-
75
-
76
-
77
-
78
-
79
-
80
-
81
-
82
-
83
-
84
-
85
-
86
-
87
-
88
-
89
-
90
-
91
-
92
-
93
-
94
-
95
-
96
-
97
-
 98
98 -
 99
99 -
 100
100 -
 101
101 -
 102
102 -
 103
103 -
 104
104 -
 105
105 -
 106
106 -
 107
107 -
 108
108 -
109
-
110
-
111
-
112
-
113
-
114
-
115
-
116
-
117
-
118
-
119
-
120
-
121
-
122
-
123
-
124
-
125
-
126
-
127
-
128
-
129
-
130
-
131
-
132
-
133
-
134
-
135
-
136
-
137
-
138
-
139
-
140
-
141
-
142
-
143
-
144
-
145
-
146
-
147
-
148
-
149
-
150
-
151
-
152
-
153
-
154
-
155
-
156
-
157
-
158
-
159
-
160
-
161
-
162
-
163
-
164
-
165
-
166
-
167
-
168
-
169
-
170
-
171
-
172
-
173
-
174
-
175
-
176
-
177
-
178
-
179
-
180
-
181
-
182
-
183
-
184
-
185
-
186
-
187
-
188
-
189
-
190
-
191
-
192
-
193
-
194
-
195
-
196
-
197
-
198
-
199
-
200
-
201
-
202
-
203
-
204
-
205
-
206
-
207
-
208
-
209
-
210
-
211
-
212
-
213
-
214
-
215
-
216
-
217
-
218
-
219
-
220
-
221
-
222
-
223
-
224
-
225
-
226
-
227
-
228
-
229
-
230
-
231
-
232
-
233
-
234
-
235
 |
 |
