Texas Instruments TI-80 User Manual - Page 95
Defining and Displaying a Parametric Graph
 |
View all Texas Instruments TI-80 manuals
Add to My Manuals
Save this manual to your list of manuals |
Page 95 highlights
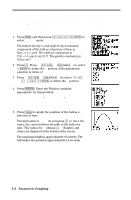
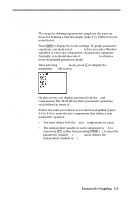
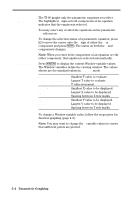
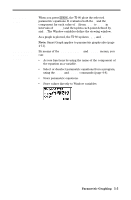
Defining and Displaying a Parametric Graph Parametric equations consist of an X component and a Y component, each expressed in terms of the same independent variable T. They are often used to graph equations over time. Up to three pairs of parametric equations can be defined and graphed at a time. Defining a Parametric Graph Setting Parametric Graph Modes Displaying Parametric Equations The steps for defining a parametric graph are the same as those for defining a function graph (page 4-3). Differences are noted below. Press 3 to display the mode settings. To graph parametric equations, you must select PARAM before you enter Window variables or enter the components of parametric equations. Normally, you should also select CONNECTED to obtain a more meaningful parametric graph. After selecting PARAM mode, press ( to display the parametric Y= edit screen. Defining Parametric Equations On this screen, you display and enter both the X and Y components. The TI-80 allows three parametric equations, each defined in terms of T. Follow the same procedures as for function graphing (pages 4-5 to 4-6) to enter the two components that define a new parametric equation. ¦ You must define both the X and Y components in a pair. ¦ The independent variable in each component is T. You may press @, rather than pressing ? ãTä, to enter the parametric variable T. (PARAM mode defines the independent variable as T.) Parametric Graphing 5-3
-
 1
1 -
2
-
3
-
4
-
5
-
6
-
7
-
8
-
9
-
10
-
11
-
12
-
13
-
14
-
15
-
16
-
17
-
18
-
19
-
20
-
21
-
22
-
23
-
24
-
25
-
26
-
27
-
28
-
29
-
30
-
31
-
32
-
33
-
34
-
35
-
36
-
37
-
38
-
39
-
40
-
41
-
42
-
43
-
44
-
45
-
46
-
47
-
48
-
49
-
50
-
51
-
52
-
53
-
54
-
55
-
56
-
57
-
58
-
59
-
60
-
61
-
62
-
63
-
64
-
65
-
66
-
67
-
68
-
69
-
70
-
71
-
72
-
73
-
74
-
75
-
76
-
77
-
78
-
79
-
80
-
81
-
82
-
83
-
84
-
85
-
86
-
87
-
88
-
89
-
 90
90 -
 91
91 -
 92
92 -
 93
93 -
 94
94 -
 95
95 -
 96
96 -
 97
97 -
 98
98 -
 99
99 -
 100
100 -
101
-
102
-
103
-
104
-
105
-
106
-
107
-
108
-
109
-
110
-
111
-
112
-
113
-
114
-
115
-
116
-
117
-
118
-
119
-
120
-
121
-
122
-
123
-
124
-
125
-
126
-
127
-
128
-
129
-
130
-
131
-
132
-
133
-
134
-
135
-
136
-
137
-
138
-
139
-
140
-
141
-
142
-
143
-
144
-
145
-
146
-
147
-
148
-
149
-
150
-
151
-
152
-
153
-
154
-
155
-
156
-
157
-
158
-
159
-
160
-
161
-
162
-
163
-
164
-
165
-
166
-
167
-
168
-
169
-
170
-
171
-
172
-
173
-
174
-
175
-
176
-
177
-
178
-
179
-
180
-
181
-
182
-
183
-
184
-
185
-
186
-
187
-
188
-
189
-
190
-
191
-
192
-
193
-
194
-
195
-
196
-
197
-
198
-
199
-
200
-
201
-
202
-
203
-
204
-
205
-
206
-
207
-
208
-
209
-
210
-
211
-
212
-
213
-
214
-
215
-
216
-
217
-
218
-
219
-
220
-
221
-
222
-
223
-
224
-
225
-
226
-
227
-
228
-
229
-
230
-
231
-
232
-
233
-
234
-
235
 |
 |
