Texas Instruments TI-80 User Manual - Page 94
Getting Started: Path of a Ball
 |
View all Texas Instruments TI-80 manuals
Add to My Manuals
Save this manual to your list of manuals |
Page 94 highlights
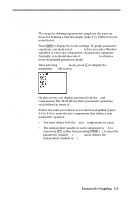
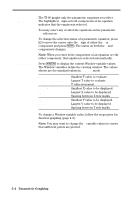
Getting Started: Path of a Ball Getting Started is a fast-paced introduction. Read the chapter for details. Graph the parametric equation that describes the path of a ball kicked at an angle of 60¡ with an initial velocity of 15 meters per second. (Ignore air resistance.) What is the maximum height? When does the ball strike the ground? 1. Press 3, and then press 8 8 8 8 8 9 ¸ to select PARAM mode. For initial velocity v0 and angle q, the horizontal component of the ball as a function of time is X(t) = t v0 cos q. The vertical component is Y(t) = t v0 sin q -(gà2) t2. The gravity constant g is 9.8 màsec2. 2. Press (. Press 15 @ X 60 2 E 1 (to select ¡) ¸ to define the X portion of the parametric equation in terms of T. 3. Press 15 @ W 60 2 E 1 (to select ¡) | c 9.8 e 2 d @ a ¸ to define the Y portion. 4. Press ). Enter the Window variables appropriate for this problem. TMIN=0 TMAX=3 TSTEP=.2 XMIN=ë2 XMAX=25 XSCL=5 YMIN=ë2 YMAX=10 YSCL=5 5. Press + to graph the position of the ball as a function of time. Tracing begins at TMIN. As you press 9~ to trace the curve, the cursor follows the path of the ball over time. The values for X (distance), Y (height), and T (time) are displayed at the bottom of the screen. The maximum height is approximately 8.6 meters. The ball strikes the ground in approximately 2.6 seconds. 5-2 Parametric Graphing
-
 1
1 -
2
-
3
-
4
-
5
-
6
-
7
-
8
-
9
-
10
-
11
-
12
-
13
-
14
-
15
-
16
-
17
-
18
-
19
-
20
-
21
-
22
-
23
-
24
-
25
-
26
-
27
-
28
-
29
-
30
-
31
-
32
-
33
-
34
-
35
-
36
-
37
-
38
-
39
-
40
-
41
-
42
-
43
-
44
-
45
-
46
-
47
-
48
-
49
-
50
-
51
-
52
-
53
-
54
-
55
-
56
-
57
-
58
-
59
-
60
-
61
-
62
-
63
-
64
-
65
-
66
-
67
-
68
-
69
-
70
-
71
-
72
-
73
-
74
-
75
-
76
-
77
-
78
-
79
-
80
-
81
-
82
-
83
-
84
-
85
-
86
-
87
-
88
-
 89
89 -
 90
90 -
 91
91 -
 92
92 -
 93
93 -
 94
94 -
 95
95 -
 96
96 -
 97
97 -
 98
98 -
 99
99 -
100
-
101
-
102
-
103
-
104
-
105
-
106
-
107
-
108
-
109
-
110
-
111
-
112
-
113
-
114
-
115
-
116
-
117
-
118
-
119
-
120
-
121
-
122
-
123
-
124
-
125
-
126
-
127
-
128
-
129
-
130
-
131
-
132
-
133
-
134
-
135
-
136
-
137
-
138
-
139
-
140
-
141
-
142
-
143
-
144
-
145
-
146
-
147
-
148
-
149
-
150
-
151
-
152
-
153
-
154
-
155
-
156
-
157
-
158
-
159
-
160
-
161
-
162
-
163
-
164
-
165
-
166
-
167
-
168
-
169
-
170
-
171
-
172
-
173
-
174
-
175
-
176
-
177
-
178
-
179
-
180
-
181
-
182
-
183
-
184
-
185
-
186
-
187
-
188
-
189
-
190
-
191
-
192
-
193
-
194
-
195
-
196
-
197
-
198
-
199
-
200
-
201
-
202
-
203
-
204
-
205
-
206
-
207
-
208
-
209
-
210
-
211
-
212
-
213
-
214
-
215
-
216
-
217
-
218
-
219
-
220
-
221
-
222
-
223
-
224
-
225
-
226
-
227
-
228
-
229
-
230
-
231
-
232
-
233
-
234
-
235
 |
 |
