Fluke 8845A FE 8845A & 8846A Users Manual - Page 53
Using TrendPlot, To enter the B value
 |
View all Fluke 8845A manuals
Add to My Manuals
Save this manual to your list of manuals |
Page 53 highlights
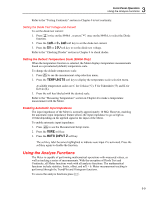
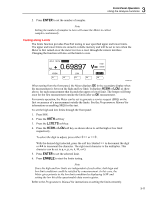
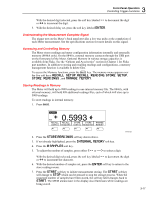
3 Front-Panel Operation Using the Analyze Functions To enter the B value: 7. Press the B soft key. To select the digit to adjust, press either . With the desired digit selected, press the soft key labeled -- to decrement the digit or ++ to increment the character. The right most character is the multiplier. This character can be set to p, n, µ, m, k, M, or G. 8. Press the ENTER soft key. 9. Press B to return to the MX+B menu. 10. Press the ENABLE soft key to start MX+B calculations. ENABLE stays highlighted, and all displayed values are the measured value modified by the formula MX+B. Pressing ENABLE again disables MX+B, and ENABLE is no longer highlighted. Using TrendPlot TrendPlot provides a visual representation of the measured signal over time. About threequarters of the Meter's display is used to plot the maximum and minimum readings vertically, while the horizontal plane represents time. The vertical and horizontal axis' are not calibrated, and only represent relative time and amplitude depending on the input signal. Each plot mark is a one pixel-wide vertical line that represents the highest (top of mark) and lowest (bottom of mark) reading the Meter has taken in the time since the previous mark was made. The left-most plot mark represents the time since TrendPlot was started. When all available plot points across the plot area are filled, the Meter compresses the plot marks to one-half of the plot area. The compression process takes the highest and lowest reading between every two plot marks, and makes a single plot mark representing the highest and lowest readings of the two combined plot marks. Future plot marks added to the end of the compressed display are now the Meter's highest and lowest readings, taken over a time period twice as long as the period before the compression. If the amplitude of the measured value exceeds the positive or negative range of the vertical axis, the Meter adjusts the vertical range to accommodate the range of the new plot point. Previously laid down plot marks are adjusted down in size proportionally to the new vertical axis. The left section of the Meter's display indicates the highest (maximum) and lowest (minimum) reading taken since the start of a TrendPlot session. In addition, the length of the TrendPlot session is displayed in hours, minutes, and seconds (hh:mm:ss). To start a TrendPlot session: 1. Set up the Meter for the desired measurement by selecting the function and connecting the signal to the Meter's input. Note Setting the range function to manual will cause the Trendplot display to plot at the top or bottom edge of the plot area without making an amplitude adjustment when the input signal exceeds the limits of the Meter's range. 2. With the Meter taking measurements, press J. 3. Press the TREND PLOT soft key to start the session. 3-13
-
 1
1 -
2
-
3
-
4
-
5
-
6
-
7
-
8
-
9
-
10
-
11
-
12
-
13
-
14
-
15
-
16
-
17
-
18
-
19
-
20
-
21
-
22
-
23
-
24
-
25
-
26
-
27
-
28
-
29
-
30
-
31
-
32
-
33
-
34
-
35
-
36
-
37
-
38
-
39
-
40
-
41
-
42
-
43
-
44
-
45
-
46
-
47
-
 48
48 -
 49
49 -
 50
50 -
 51
51 -
 52
52 -
 53
53 -
 54
54 -
 55
55 -
 56
56 -
 57
57 -
 58
58 -
59
-
60
-
61
-
62
-
63
-
64
-
65
-
66
-
67
-
68
-
69
-
70
-
71
-
72
-
73
-
74
-
75
-
76
-
77
-
78
-
79
-
80
-
81
-
82
-
83
-
84
-
85
-
86
-
87
-
88
-
89
-
90
-
91
-
92
-
93
 |
 |
