Fluke 8845A FE 8845A & 8846A Users Manual - Page 54
Using the Histogram Function, RESTART, HISTOGRAM
 |
View all Fluke 8845A manuals
Add to My Manuals
Save this manual to your list of manuals |
Page 54 highlights
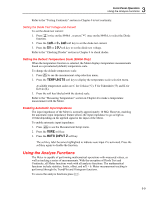
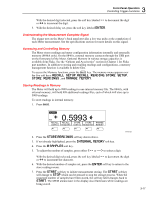
8845A/8846A Users Manual As shown in Figure 3-1, the display will start plotting the readings across the plot area, and the maximum, minimum, and elapsed time are displayed. STOP F1 F2 F3 F4 F5 Figure 3-1. TrendPlot Display To stop the TrendPlot session, press B or the STOP soft key. To start the TrendPlot session over, press the STOP soft key followed by the RESTART soft key. caw057.eps Using the Histogram Function The Histogram function provides a graphical representation of the standard deviation of a series of measurements. The right two-thirds of the Meter's display is used as a bar graph chart. The vertical axis is a relative measure of the number of readings while 10 vertical bars represent the standard deviation across the horizontal axis. The two center bars indicates the number of readings that fall on either side of the average reading within the 1st standard deviation. The two bars on either side of the center two bars represent the number of readings that fall within the 2nd standard deviation. The next two represent the 3rd standard deviation and so on to the 5th standard deviation. The histogram function is helpful in looking at the standard distribution of the UUT. While observing the bar graph display (see Figure 3-2), adjust the UUT variable control to peak the center two bars of the histogram. F1 F2 F3 F4 F5 Figure 3-2. Histogram Display caw056.eps In addition to the bar graph, the left third of the display also displays the number of samples, the average, and standard deviation values. To start a histogram session: 1. Set up the Meter for the desired measurement by selecting the function, and connecting the signal to the Meter's input. 2. With the Meter taking measurements, press J. 3. Press HISTOGRAM to start the session. 3-14
-
 1
1 -
2
-
3
-
4
-
5
-
6
-
7
-
8
-
9
-
10
-
11
-
12
-
13
-
14
-
15
-
16
-
17
-
18
-
19
-
20
-
21
-
22
-
23
-
24
-
25
-
26
-
27
-
28
-
29
-
30
-
31
-
32
-
33
-
34
-
35
-
36
-
37
-
38
-
39
-
40
-
41
-
42
-
43
-
44
-
45
-
46
-
47
-
48
-
 49
49 -
 50
50 -
 51
51 -
 52
52 -
 53
53 -
 54
54 -
 55
55 -
 56
56 -
 57
57 -
 58
58 -
 59
59 -
60
-
61
-
62
-
63
-
64
-
65
-
66
-
67
-
68
-
69
-
70
-
71
-
72
-
73
-
74
-
75
-
76
-
77
-
78
-
79
-
80
-
81
-
82
-
83
-
84
-
85
-
86
-
87
-
88
-
89
-
90
-
91
-
92
-
93
 |
 |
