Garmin aera 660 aera 660 Pilot s Guide - Page 101
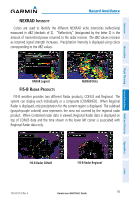
When Regional, Radar is displayed, only precipitation for the current region is displayed.
 |
View all Garmin aera 660 manuals
Add to My Manuals
Save this manual to your list of manuals |
Page 101 highlights
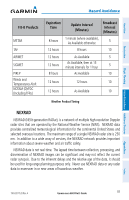
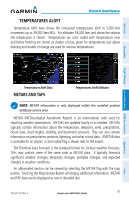
Overview Navigation Flight Planning Hazard Avoidance Additional Features Hazard Avoidance NEXRAD Intensity Colors are used to identify the different NEXRAD echo intensities (reflectivity) measured in dBZ (decibels of Z). "Reflectivity" (designated by the letter Z) is the amount of transmitted power returned to the radar receiver. The dBZ values increase as returned signal strength increases. Precipitation intensity is displayed using colors corresponding to the dBZ values. RADAR Legend NEXRAD Data FIS-B Radar Products FIS-B weather provides two different Radar products, CONUS and Regional. The system can display each individually or a composite (COMBINED). When Regional Radar is displayed, only precipitation for the current region is displayed. The subdued (grayish-purple colored) area represents the area not covered by the regional radar product. When Combined radar data is viewed, Regional Radar data is displayed on top of CONUS data and the time shown in the lower left corner is associated with Regional Radar data only. Appendices Index FIS-B Radar CONUS FIS-B Radar Regional 190-02017-20 Rev. A Garmin aera 660 Pilot's Guide 85
-
 1
1 -
2
-
3
-
4
-
5
-
6
-
7
-
8
-
9
-
10
-
11
-
12
-
13
-
14
-
15
-
16
-
17
-
18
-
19
-
20
-
21
-
22
-
23
-
24
-
25
-
26
-
27
-
28
-
29
-
30
-
31
-
32
-
33
-
34
-
35
-
36
-
37
-
38
-
39
-
40
-
41
-
42
-
43
-
44
-
45
-
46
-
47
-
48
-
49
-
50
-
51
-
52
-
53
-
54
-
55
-
56
-
57
-
58
-
59
-
60
-
61
-
62
-
63
-
64
-
65
-
66
-
67
-
68
-
69
-
70
-
71
-
72
-
73
-
74
-
75
-
76
-
77
-
78
-
79
-
80
-
81
-
82
-
83
-
84
-
85
-
86
-
87
-
88
-
89
-
90
-
91
-
92
-
93
-
94
-
95
-
 96
96 -
 97
97 -
 98
98 -
 99
99 -
 100
100 -
 101
101 -
 102
102 -
 103
103 -
 104
104 -
 105
105 -
 106
106 -
107
-
108
-
109
-
110
-
111
-
112
-
113
-
114
-
115
-
116
-
117
-
118
-
119
-
120
-
121
-
122
-
123
-
124
-
125
-
126
-
127
-
128
-
129
-
130
-
131
-
132
-
133
-
134
-
135
-
136
-
137
-
138
-
139
-
140
-
141
-
142
-
143
-
144
-
145
-
146
-
147
-
148
-
149
-
150
-
151
-
152
-
153
-
154
-
155
-
156
-
157
-
158
-
159
-
160
-
161
-
162
-
163
-
164
-
165
-
166
-
167
-
168
-
169
-
170
-
171
-
172
-
173
-
174
-
175
-
176
-
177
-
178
-
179
-
180
-
181
-
182
-
183
-
184
-
185
-
186
-
187
-
188
-
189
-
190
-
191
-
192
-
193
-
194
-
195
-
196
-
197
-
198
-
199
-
200
-
201
-
202
-
203
-
204
 |
 |
