Dell OpenManage Network Manager Web Client Guide 5.1 - Page 102
Notification OID, Assigned User
 |
View all Dell OpenManage Network Manager manuals
Add to My Manuals
Save this manual to your list of manuals |
Page 102 highlights
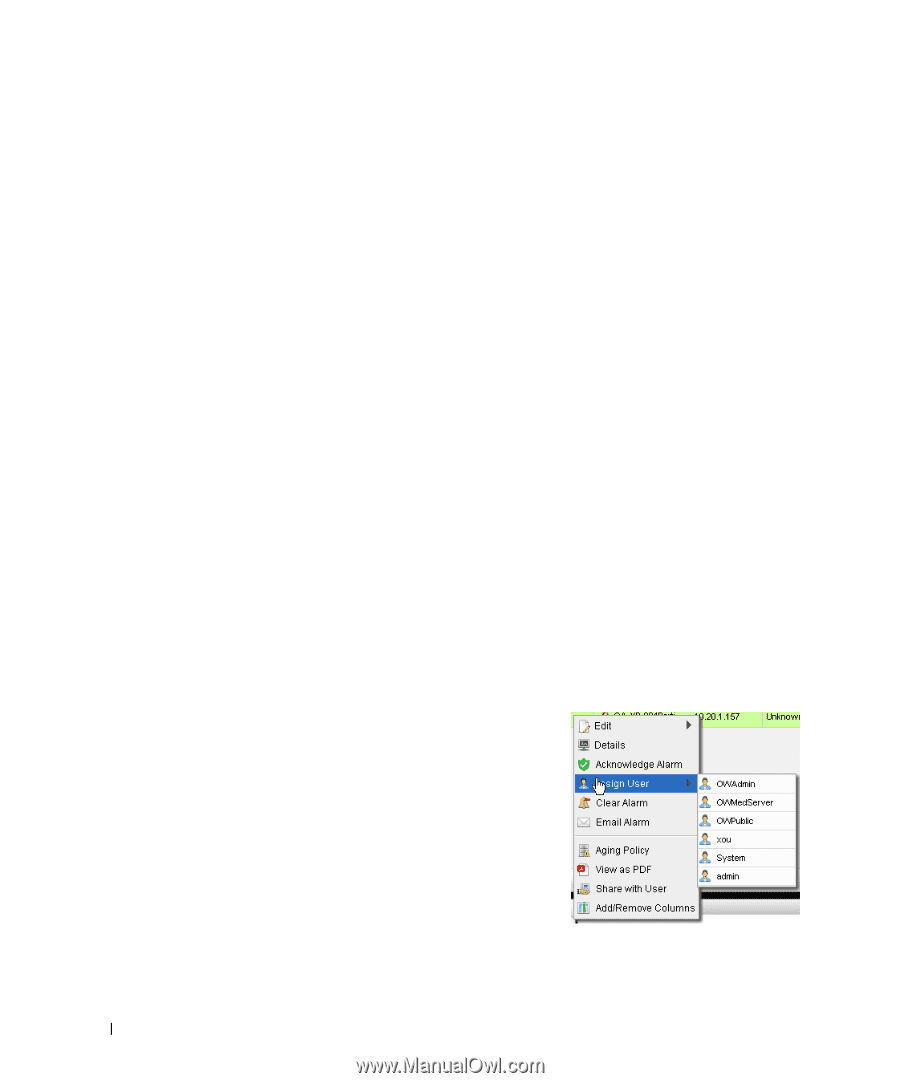
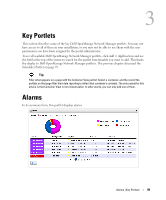
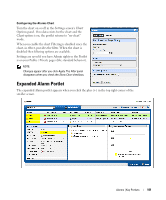
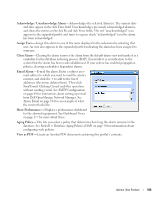
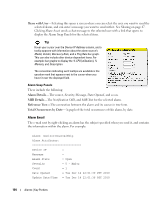
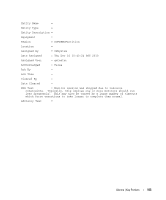
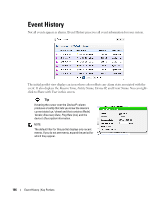
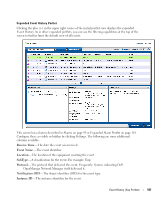
This displays listed alarms and Snap Panel details of a selected alarm. By default this screen adds the first of the following columns to those visible in the Event History's summary screen view. To add the others listed here, right click, and select Add Columns to change the screen appearance. The following are available additional columns, besides those visible in the Alarms summary portlet: Count- A count of the instances of the alarm. Multiples of the same alarm appear as a single row, but increment this count. Entity Type- The type of monitored entity. Message-Any message that accompanies the alarm / event. Alarm State-The state (open / closed) of the alarm. Date Cleared-The date and time that the alarm was closed. UpdateDate Time- The time stamp for when this alarm was updated (for an additional count, the time the last duplicate was received). Notification OID-The identifier of the notification displayed as an alarm. Equipment-The name for the entity emitting the alarm. Acknowledged-True or False. Assigned User- The user who has been assigned this alarm (right click or click Action to do this). Date Assigned-The date and time that the alarm was assigned. Ack Time-The time the alarm was acknowledged. Cleared By-The user who cleared the alarm. MIB Text-The alarm's MIB Text. Rather than filtering with the pie graph, the expanded portlet lets you either the pick list at the top left, or create custom filtering by clicking Advanced Filters. Menu Right clicking an alarm lets you select from the following menu items: Edit-Access the editors for Event Definition (see Event Definition Editor on page 128) or the Details screen for the entity emitting the alarm (see Equipment Details on page 178 for an example). Details- Open a Details screen for the alarm itself, not the entity emitting it. This contains information like the MIB text, any Event Processing Rules invoked, and a Reference Tree for the alarm. Visualize-Display a topology map that includes the selected alarm(s). See Chapter 5, Visualize My Network for more about these maps. 102 Alarms | Key Portlets
-
 1
1 -
2
-
3
-
4
-
5
-
6
-
7
-
8
-
9
-
10
-
11
-
12
-
13
-
14
-
15
-
16
-
17
-
18
-
19
-
20
-
21
-
22
-
23
-
24
-
25
-
26
-
27
-
28
-
29
-
30
-
31
-
32
-
33
-
34
-
35
-
36
-
37
-
38
-
39
-
40
-
41
-
42
-
43
-
44
-
45
-
46
-
47
-
48
-
49
-
50
-
51
-
52
-
53
-
54
-
55
-
56
-
57
-
58
-
59
-
60
-
61
-
62
-
63
-
64
-
65
-
66
-
67
-
68
-
69
-
70
-
71
-
72
-
73
-
74
-
75
-
76
-
77
-
78
-
79
-
80
-
81
-
82
-
83
-
84
-
85
-
86
-
87
-
88
-
89
-
90
-
91
-
92
-
93
-
94
-
95
-
96
-
 97
97 -
 98
98 -
 99
99 -
 100
100 -
 101
101 -
 102
102 -
 103
103 -
 104
104 -
 105
105 -
 106
106 -
 107
107 -
108
-
109
-
110
-
111
-
112
-
113
-
114
-
115
-
116
-
117
-
118
-
119
-
120
-
121
-
122
-
123
-
124
-
125
-
126
-
127
-
128
-
129
-
130
-
131
-
132
-
133
-
134
-
135
-
136
-
137
-
138
-
139
-
140
-
141
-
142
-
143
-
144
-
145
-
146
-
147
-
148
-
149
-
150
-
151
-
152
-
153
-
154
-
155
-
156
-
157
-
158
-
159
-
160
-
161
-
162
-
163
-
164
-
165
-
166
-
167
-
168
-
169
-
170
-
171
-
172
-
173
-
174
-
175
-
176
-
177
-
178
-
179
-
180
-
181
-
182
-
183
-
184
-
185
-
186
-
187
-
188
-
189
-
190
-
191
-
192
-
193
-
194
-
195
-
196
-
197
-
198
-
199
-
200
-
201
-
202
-
203
-
204
-
205
-
206
-
207
-
208
-
209
-
210
-
211
-
212
-
213
-
214
-
215
-
216
-
217
-
218
-
219
-
220
-
221
-
222
-
223
-
224
-
225
-
226
-
227
-
228
-
229
-
230
-
231
-
232
-
233
-
234
-
235
-
236
-
237
-
238
-
239
-
240
-
241
-
242
-
243
-
244
-
245
-
246
-
247
-
248
-
249
-
250
-
251
-
252
-
253
-
254
-
255
-
256
-
257
-
258
-
259
-
260
-
261
-
262
-
263
-
264
-
265
-
266
-
267
-
268
-
269
-
270
-
271
-
272
-
273
-
274
-
275
-
276
-
277
-
278
-
279
-
280
-
281
-
282
-
283
-
284
-
285
-
286
-
287
-
288
-
289
-
290
-
291
-
292
-
293
-
294
-
295
-
296
-
297
-
298
-
299
-
300
-
301
-
302
-
303
-
304
-
305
-
306
-
307
-
308
-
309
-
310
-
311
-
312
-
313
-
314
-
315
-
316
-
317
-
318
-
319
-
320
-
321
-
322
-
323
-
324
-
325
-
326
-
327
-
328
-
329
-
330
-
331
-
332
-
333
-
334
-
335
-
336
-
337
-
338
-
339
-
340
-
341
-
342
-
343
-
344
-
345
-
346
-
347
-
348
-
349
-
350
-
351
-
352
-
353
-
354
-
355
-
356
-
357
-
358
-
359
-
360
-
361
-
362
-
363
-
364
-
365
-
366
-
367
-
368
-
369
-
370
-
371
-
372
-
373
-
374
-
375
-
376
-
377
-
378
-
379
-
380
-
381
-
382
-
383
-
384
-
385
-
386
-
387
-
388
 |
 |