Garmin GPSMAP 76CSx Owner's Manual - Page 42
Adjusting the Zoom Ranges, View Points
 |
UPC - 753759051648
View all Garmin GPSMAP 76CSx manuals
Add to My Manuals
Save this manual to your list of manuals |
Page 42 highlights
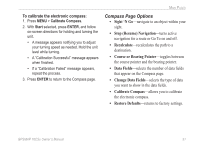
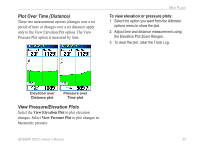
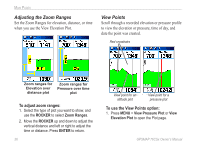
Main Pages Adjusting the Zoom Ranges Set the Zoom Ranges for elevation, distance, or time when you use the View Elevation Plot. View Points Scroll through a recorded elevation or pressure profile to view the elevation or pressure, time of day, and date the point was created. Red crosshairs Zoom ranges for Elevation over distance plot Zoom ranges for Pressure over time plot To adjust zoom ranges: 1. Select the type of plot you want to show, and use the ROCKER to select Zoom Ranges. 2. Move the ROCKER up and down to adjust the vertical distance and left or right to adjust the time or distance. Press ENTER to return. 36 View point for an altitude plot View point for a pressure plot To use the View Points option: 1. Press MENU > View Pressure Plot or View Elevation Plot to open the Plot page. GPSMAP 76CSx Owner's Manual
-
 1
1 -
2
-
3
-
4
-
5
-
6
-
7
-
8
-
9
-
10
-
11
-
12
-
13
-
14
-
15
-
16
-
17
-
18
-
19
-
20
-
21
-
22
-
23
-
24
-
25
-
26
-
27
-
28
-
29
-
30
-
31
-
32
-
33
-
34
-
35
-
36
-
 37
37 -
 38
38 -
 39
39 -
 40
40 -
 41
41 -
 42
42 -
 43
43 -
 44
44 -
 45
45 -
 46
46 -
 47
47 -
48
-
49
-
50
-
51
-
52
-
53
-
54
-
55
-
56
-
57
-
58
-
59
-
60
-
61
-
62
-
63
-
64
 |
 |
