HP 39g hp 39g+ (39g & 40g)_mastering the hp 39g+_English_E_F2224-90010.pdf - Page 152
and check, that the test level is correct at 0.05 5%.
 |
View all HP 39g manuals
Add to My Manuals
Save this manual to your list of manuals |
Page 152 highlights
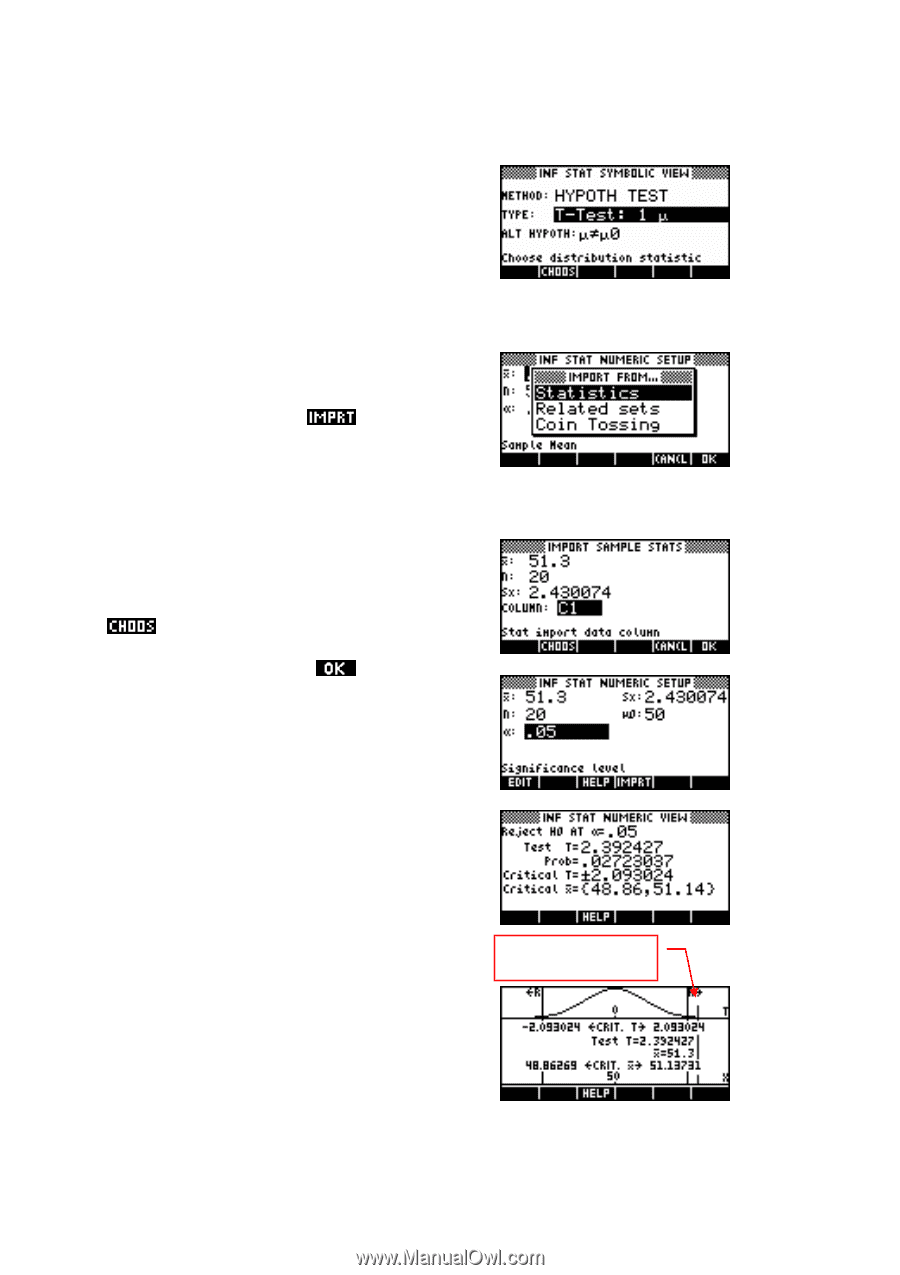
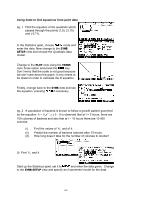
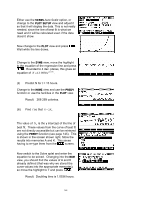
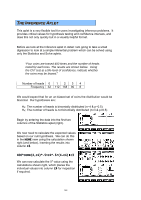
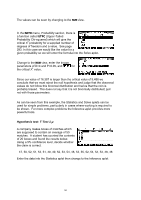
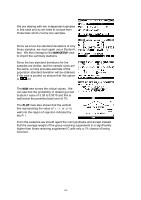
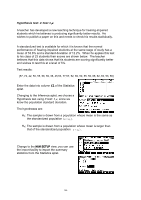
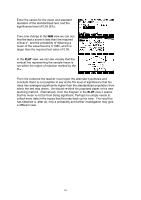
Choose the test and the alternate hypothesis in the SYMB view of the Inference aplet. In this case we are working with a single sample and we do not know the standard deviation of the underlying population, so we will use the Student-t test and the alternate hypothesis that the mean of the real underlying population from which the sample was drawn is not equal to that of the proposed underlying population. Change now to the NUM SETUP view to enter the required values. Rather than entering them by hand, press the key. If you have more than one copy of the Statistics aplet (under other names) then you will be presented with a list of aplets from which to choose. Once you have chosen the aplet, you need to nominate the column from which to import the data. The default is column C1, which is what we want in this case, but you can press the key to select from a list of any other columns which contain data. When you have the correct column, press . Enter the population mean µ0 = 50, and check that the test level is correct at 0.05 (5%). If you now change to the NUM view you will see the inferential data in numeric form. The test Student-t value is given as 2.392 and the probability of obtaining such a value as 0.0272. The critical t values for this test level of 5% are given as ± 2.093 and the critical boundaries for the sample mean as 48.86 and 51.14. Sample t value is outside rejection The same information can be seen in a more visual form if you change to the PLOT view. The upper diagram shows the critical range for the t values, while the lower horizontal line shows the equivalent critical sample mean range. 152
-
 1
1 -
2
-
3
-
4
-
5
-
6
-
7
-
8
-
9
-
10
-
11
-
12
-
13
-
14
-
15
-
16
-
17
-
18
-
19
-
20
-
21
-
22
-
23
-
24
-
25
-
26
-
27
-
28
-
29
-
30
-
31
-
32
-
33
-
34
-
35
-
36
-
37
-
38
-
39
-
40
-
41
-
42
-
43
-
44
-
45
-
46
-
47
-
48
-
49
-
50
-
51
-
52
-
53
-
54
-
55
-
56
-
57
-
58
-
59
-
60
-
61
-
62
-
63
-
64
-
65
-
66
-
67
-
68
-
69
-
70
-
71
-
72
-
73
-
74
-
75
-
76
-
77
-
78
-
79
-
80
-
81
-
82
-
83
-
84
-
85
-
86
-
87
-
88
-
89
-
90
-
91
-
92
-
93
-
94
-
95
-
96
-
97
-
98
-
99
-
100
-
101
-
102
-
103
-
104
-
105
-
106
-
107
-
108
-
109
-
110
-
111
-
112
-
113
-
114
-
115
-
116
-
117
-
118
-
119
-
120
-
121
-
122
-
123
-
124
-
125
-
126
-
127
-
128
-
129
-
130
-
131
-
132
-
133
-
134
-
135
-
136
-
137
-
138
-
139
-
140
-
141
-
142
-
143
-
144
-
145
-
146
-
 147
147 -
 148
148 -
 149
149 -
 150
150 -
 151
151 -
 152
152 -
 153
153 -
 154
154 -
 155
155 -
 156
156 -
 157
157 -
158
-
159
-
160
-
161
-
162
-
163
-
164
-
165
-
166
-
167
-
168
-
169
-
170
-
171
-
172
-
173
-
174
-
175
-
176
-
177
-
178
-
179
-
180
-
181
-
182
-
183
-
184
-
185
-
186
-
187
-
188
-
189
-
190
-
191
-
192
-
193
-
194
-
195
-
196
-
197
-
198
-
199
-
200
-
201
-
202
-
203
-
204
-
205
-
206
-
207
-
208
-
209
-
210
-
211
-
212
-
213
-
214
-
215
-
216
-
217
-
218
-
219
-
220
-
221
-
222
-
223
-
224
-
225
-
226
-
227
-
228
-
229
-
230
-
231
-
232
-
233
-
234
-
235
-
236
-
237
-
238
-
239
-
240
-
241
-
242
-
243
-
244
-
245
-
246
-
247
-
248
-
249
-
250
-
251
-
252
-
253
-
254
-
255
-
256
-
257
-
258
-
259
-
260
-
261
-
262
-
263
-
264
-
265
-
266
-
267
-
268
-
269
-
270
-
271
-
272
-
273
-
274
-
275
-
276
-
277
-
278
-
279
-
280
-
281
-
282
-
283
-
284
-
285
-
286
-
287
-
288
-
289
-
290
-
291
-
292
-
293
-
294
-
295
-
296
-
297
-
298
-
299
-
300
-
301
-
302
-
303
-
304
-
305
-
306
-
307
-
308
-
309
-
310
-
311
-
312
-
313
-
314
-
315
-
316
-
317
-
318
-
319
-
320
-
321
-
322
-
323
-
324
-
325
-
326
-
327
-
328
-
329
-
330
-
331
 |
 |