HP 113394 User Guide - Page 94
Correcting Accumulated Statistics
 |
UPC - 808736340502
View all HP 113394 manuals
Add to My Manuals
Save this manual to your list of manuals |
Page 94 highlights
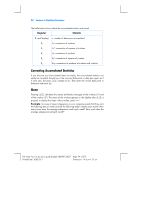
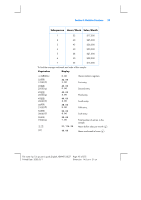
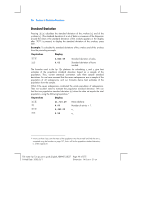
94 Section 6: Statistics Functions The table below shows where the accumulated statistics are stored. Register Statistic R1 (and display) R2 R3 R4 R5 R6 n: number of data pairs accumulated. Σx: summation of x-values. Σx2: summation of squares of x-values. Σy: summation of y-values. Σy2 summation of squares of y-values. Σxy: summation of products of x-values and y-values. Correcting Accumulated Statistics If you discover you have entered data incorrectly, the accumulated statistics can easily be corrected. Simply key in the incorrect data point or data pair again as if it were new, but press g^ instead of _. Then enter the correct data point or data pair and press _. Mean Pressing gÖ calculates the means (arithmetic averages) of the x-values ( x ) and of the y-values ( y ). The mean of the x-values appears in the display after gÖ is pressed; to display the mean of the y-values, press ~. Example: A survey of seven salespersons in your company reveals that they work the following hours a week and sell the following dollar volumes each month. How many hours does the average salesperson work each week? How much does the average salesperson sell each month? File name: hp 12c pt_user's guide_English_HDPMF123E27 Page: 94 of 275 Printed Date: 2005/8/1 Dimension: 14.8 cm x 21 cm
-
 1
1 -
2
-
3
-
4
-
5
-
6
-
7
-
8
-
9
-
10
-
11
-
12
-
13
-
14
-
15
-
16
-
17
-
18
-
19
-
20
-
21
-
22
-
23
-
24
-
25
-
26
-
27
-
28
-
29
-
30
-
31
-
32
-
33
-
34
-
35
-
36
-
37
-
38
-
39
-
40
-
41
-
42
-
43
-
44
-
45
-
46
-
47
-
48
-
49
-
50
-
51
-
52
-
53
-
54
-
55
-
56
-
57
-
58
-
59
-
60
-
61
-
62
-
63
-
64
-
65
-
66
-
67
-
68
-
69
-
70
-
71
-
72
-
73
-
74
-
75
-
76
-
77
-
78
-
79
-
80
-
81
-
82
-
83
-
84
-
85
-
86
-
87
-
88
-
 89
89 -
 90
90 -
 91
91 -
 92
92 -
 93
93 -
 94
94 -
 95
95 -
 96
96 -
 97
97 -
 98
98 -
 99
99 -
100
-
101
-
102
-
103
-
104
-
105
-
106
-
107
-
108
-
109
-
110
-
111
-
112
-
113
-
114
-
115
-
116
-
117
-
118
-
119
-
120
-
121
-
122
-
123
-
124
-
125
-
126
-
127
-
128
-
129
-
130
-
131
-
132
-
133
-
134
-
135
-
136
-
137
-
138
-
139
-
140
-
141
-
142
-
143
-
144
-
145
-
146
-
147
-
148
-
149
-
150
-
151
-
152
-
153
-
154
-
155
-
156
-
157
-
158
-
159
-
160
-
161
-
162
-
163
-
164
-
165
-
166
-
167
-
168
-
169
-
170
-
171
-
172
-
173
-
174
-
175
-
176
-
177
-
178
-
179
-
180
-
181
-
182
-
183
-
184
-
185
-
186
-
187
-
188
-
189
-
190
-
191
-
192
-
193
-
194
-
195
-
196
-
197
-
198
-
199
-
200
-
201
-
202
-
203
-
204
-
205
-
206
-
207
-
208
-
209
-
210
-
211
-
212
-
213
-
214
-
215
-
216
-
217
-
218
-
219
-
220
-
221
-
222
-
223
-
224
-
225
-
226
-
227
-
228
-
229
-
230
-
231
-
232
-
233
-
234
-
235
-
236
-
237
-
238
-
239
-
240
-
241
-
242
-
243
-
244
-
245
-
246
-
247
-
248
-
249
-
250
-
251
-
252
-
253
-
254
-
255
-
256
-
257
-
258
-
259
-
260
-
261
-
262
-
263
-
264
-
265
-
266
-
267
-
268
-
269
-
270
-
271
-
272
-
273
-
274
-
275
-
276
-
277
-
278
 |
 |