HP 113394 User Guide - Page 97
Linear Estimation
 |
UPC - 808736340502
View all HP 113394 manuals
Add to My Manuals
Save this manual to your list of manuals |
Page 97 highlights
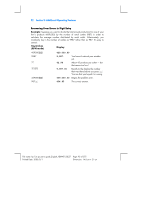
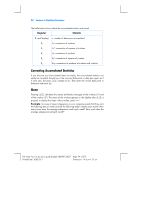
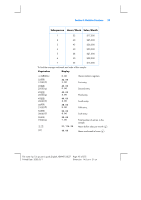
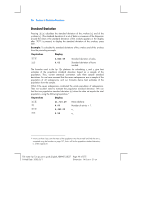
Section 6: Statistics Functions 97 To continue summing data pairs, press gÖg^ before entering more data. Note: In some cases involving data values that differ by a relatively small amount, the calculator cannot compute the standard deviation or the linear estimation accurately because such calculations would exceed the precision of the calculator. For instance, while the standard deviation of the values 1,999,999; 2,000,000 and 2,000,001 is 1; the standard deviation returned by the hp 12c platinum is 0 due to the effect of roundoff. This will not happen, however, if you normalize the data by keying only the difference between each value and the mean or approximate mean of the values. In the preceding example, the correct result can be obtained using the values -1, 0 and 1 instead. Just remember to add the difference (2,000,000) back to the calculation of the average. Linear Estimation With two-variable statistical data accumulated in the statistics registers, you can estimate a new y-value ( yˆ ) given a new x-value, and estimate a new x-value ( xˆ ) given a new y-value. To calculate yˆ and Q 1. Key in a new x-value. 2. Press gR. To calculate xˆ : 1. Key in a new y-value. 2. Press gQ. Example: Using the accumulated statistics from the preceding problem, estimate the amount of sales delivered by a new salesperson working 48 hours per week. Keystrokes Display 48gQ 28,818.93 Estimated sales for a 48 hour workweek. The reliability of a linear estimate depends upon how closely the data pairs would, if plotted on a graph, lie in a straight line. The usual measure of this reliability is the correlation coefficient, r. This quantity is automatically calculated whenever yˆ or xˆ is calculated; to display it, press ~. A correlation coefficient close to 1 or -1 indicates that the data pairs lie very close to a straight line. On the other hand, a correlation coefficient close to 0 indicates that the data pairs do not lie closely to a straight line; and a linear estimate using this data would not be very reliable. File name: hp 12c pt_user's guide_English_HDPMF123E27 Page: 97 of 275 Printed Date: 2005/8/1 Dimension: 14.8 cm x 21 cm
-
 1
1 -
2
-
3
-
4
-
5
-
6
-
7
-
8
-
9
-
10
-
11
-
12
-
13
-
14
-
15
-
16
-
17
-
18
-
19
-
20
-
21
-
22
-
23
-
24
-
25
-
26
-
27
-
28
-
29
-
30
-
31
-
32
-
33
-
34
-
35
-
36
-
37
-
38
-
39
-
40
-
41
-
42
-
43
-
44
-
45
-
46
-
47
-
48
-
49
-
50
-
51
-
52
-
53
-
54
-
55
-
56
-
57
-
58
-
59
-
60
-
61
-
62
-
63
-
64
-
65
-
66
-
67
-
68
-
69
-
70
-
71
-
72
-
73
-
74
-
75
-
76
-
77
-
78
-
79
-
80
-
81
-
82
-
83
-
84
-
85
-
86
-
87
-
88
-
89
-
90
-
91
-
 92
92 -
 93
93 -
 94
94 -
 95
95 -
 96
96 -
 97
97 -
 98
98 -
 99
99 -
 100
100 -
 101
101 -
 102
102 -
103
-
104
-
105
-
106
-
107
-
108
-
109
-
110
-
111
-
112
-
113
-
114
-
115
-
116
-
117
-
118
-
119
-
120
-
121
-
122
-
123
-
124
-
125
-
126
-
127
-
128
-
129
-
130
-
131
-
132
-
133
-
134
-
135
-
136
-
137
-
138
-
139
-
140
-
141
-
142
-
143
-
144
-
145
-
146
-
147
-
148
-
149
-
150
-
151
-
152
-
153
-
154
-
155
-
156
-
157
-
158
-
159
-
160
-
161
-
162
-
163
-
164
-
165
-
166
-
167
-
168
-
169
-
170
-
171
-
172
-
173
-
174
-
175
-
176
-
177
-
178
-
179
-
180
-
181
-
182
-
183
-
184
-
185
-
186
-
187
-
188
-
189
-
190
-
191
-
192
-
193
-
194
-
195
-
196
-
197
-
198
-
199
-
200
-
201
-
202
-
203
-
204
-
205
-
206
-
207
-
208
-
209
-
210
-
211
-
212
-
213
-
214
-
215
-
216
-
217
-
218
-
219
-
220
-
221
-
222
-
223
-
224
-
225
-
226
-
227
-
228
-
229
-
230
-
231
-
232
-
233
-
234
-
235
-
236
-
237
-
238
-
239
-
240
-
241
-
242
-
243
-
244
-
245
-
246
-
247
-
248
-
249
-
250
-
251
-
252
-
253
-
254
-
255
-
256
-
257
-
258
-
259
-
260
-
261
-
262
-
263
-
264
-
265
-
266
-
267
-
268
-
269
-
270
-
271
-
272
-
273
-
274
-
275
-
276
-
277
-
278
 |
 |