HP 113394 User Guide - Page 98
Statistics Functions
 |
UPC - 808736340502
View all HP 113394 manuals
Add to My Manuals
Save this manual to your list of manuals |
Page 98 highlights
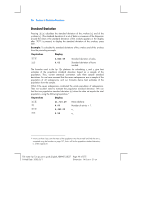
98 Section 6: Statistics Functions Example: Check the reliability of the linear estimate in the preceding example by displaying the correlation coefficient. Keystrokes Display ~ 0.90 The correlation coefficient is close to 1, so the sales calculated in the preceding example is a good estimate. To graph the regression line, calculate the coefficients of the linear equation y = A + Bx. 1. Press 0gR to compute the y-intercept (A). 2. To compute the slope of the line (B) in RPN mode, press 1gR~d~-. To compute the slope of the line (B) in ALG mode, press these keys: 1gR~d-~}. Example: Compute the slope and intercept of the regression line in the preceding example. Keystrokes (RPN mode) Display 0gR 1 gR~d~- 15.55 0.001 y-intercept (A); projected value for x = 0. Slope of the line (B); indicates the change in the projected values caused by an incremental change in the x value. Keystrokes (ALG mode) Display 0gR 15.55 1gR~d-~} 0.001 y-intercept (A); projected value for x = 0. Slope of the line (B); indicates the change in the projected values caused by an incremental change in the x value. The equation that describes the regression line is: y = 15.55 + 0.001x File name: hp 12c pt_user's guide_English_HDPMF123E27 Page: 98 of 275 Printed Date: 2005/8/1 Dimension: 14.8 cm x 21 cm
-
 1
1 -
2
-
3
-
4
-
5
-
6
-
7
-
8
-
9
-
10
-
11
-
12
-
13
-
14
-
15
-
16
-
17
-
18
-
19
-
20
-
21
-
22
-
23
-
24
-
25
-
26
-
27
-
28
-
29
-
30
-
31
-
32
-
33
-
34
-
35
-
36
-
37
-
38
-
39
-
40
-
41
-
42
-
43
-
44
-
45
-
46
-
47
-
48
-
49
-
50
-
51
-
52
-
53
-
54
-
55
-
56
-
57
-
58
-
59
-
60
-
61
-
62
-
63
-
64
-
65
-
66
-
67
-
68
-
69
-
70
-
71
-
72
-
73
-
74
-
75
-
76
-
77
-
78
-
79
-
80
-
81
-
82
-
83
-
84
-
85
-
86
-
87
-
88
-
89
-
90
-
91
-
92
-
 93
93 -
 94
94 -
 95
95 -
 96
96 -
 97
97 -
 98
98 -
 99
99 -
 100
100 -
 101
101 -
 102
102 -
 103
103 -
104
-
105
-
106
-
107
-
108
-
109
-
110
-
111
-
112
-
113
-
114
-
115
-
116
-
117
-
118
-
119
-
120
-
121
-
122
-
123
-
124
-
125
-
126
-
127
-
128
-
129
-
130
-
131
-
132
-
133
-
134
-
135
-
136
-
137
-
138
-
139
-
140
-
141
-
142
-
143
-
144
-
145
-
146
-
147
-
148
-
149
-
150
-
151
-
152
-
153
-
154
-
155
-
156
-
157
-
158
-
159
-
160
-
161
-
162
-
163
-
164
-
165
-
166
-
167
-
168
-
169
-
170
-
171
-
172
-
173
-
174
-
175
-
176
-
177
-
178
-
179
-
180
-
181
-
182
-
183
-
184
-
185
-
186
-
187
-
188
-
189
-
190
-
191
-
192
-
193
-
194
-
195
-
196
-
197
-
198
-
199
-
200
-
201
-
202
-
203
-
204
-
205
-
206
-
207
-
208
-
209
-
210
-
211
-
212
-
213
-
214
-
215
-
216
-
217
-
218
-
219
-
220
-
221
-
222
-
223
-
224
-
225
-
226
-
227
-
228
-
229
-
230
-
231
-
232
-
233
-
234
-
235
-
236
-
237
-
238
-
239
-
240
-
241
-
242
-
243
-
244
-
245
-
246
-
247
-
248
-
249
-
250
-
251
-
252
-
253
-
254
-
255
-
256
-
257
-
258
-
259
-
260
-
261
-
262
-
263
-
264
-
265
-
266
-
267
-
268
-
269
-
270
-
271
-
272
-
273
-
274
-
275
-
276
-
277
-
278
 |
 |