HP StorageWorks MSA 2/8 HP StorageWorks Advanced Performance Monitoring V3.1.x - Page 25
Managing Performance Monitoring Using Web Tools
 |
View all HP StorageWorks MSA 2/8 manuals
Add to My Manuals
Save this manual to your list of manuals |
Page 25 highlights
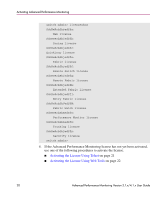
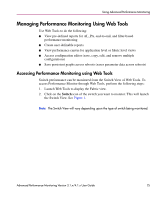
Using Advanced Performance Monitoring Managing Performance Monitoring Using Web Tools Use Web Tools to do the following: ■ View pre-defined reports for AL_PA, end-to-end, and filter-based performance monitoring ■ Create user-definable reports ■ View performance canvas for application level or fabric level views ■ Access configuration editor (save, copy, edit, and remove multiple configurations) ■ Save persistent graphs across reboots (saves parameter data across reboots) Accessing Performance Monitoring using Web Tools Switch performance can be monitored from the Switch View of Web Tools. To access Performance Monitor through Web Tools, perform the following steps: 1. Launch Web Tools to display the Fabric view. 2. Click on the Switch icon of the switch you want to monitor. This will launch the Switch View. See Figure 1. Note: The Switch View will vary depending upon the type of switch being monitored. Advanced Performance Monitoring Version 3.1.x/4.1.x User Guide 25
-
 1
1 -
2
-
3
-
4
-
5
-
6
-
7
-
8
-
9
-
10
-
11
-
12
-
13
-
14
-
15
-
16
-
17
-
18
-
19
-
 20
20 -
 21
21 -
 22
22 -
 23
23 -
 24
24 -
 25
25 -
 26
26 -
 27
27 -
 28
28 -
 29
29 -
 30
30 -
31
-
32
-
33
-
34
-
35
-
36
-
37
-
38
-
39
-
40
-
41
-
42
-
43
-
44
-
45
-
46
-
47
-
48
-
49
-
50
-
51
-
52
-
53
-
54
-
55
-
56
-
57
-
58
-
59
-
60
-
61
-
62
-
63
-
64
-
65
-
66
-
67
-
68
-
69
-
70
-
71
-
72
-
73
-
74
-
75
-
76
-
77
-
78
-
79
-
80
-
81
-
82
-
83
-
84
-
85
-
86
 |
 |