HP StorageWorks MSA 2/8 HP StorageWorks Advanced Performance Monitoring V3.1.x - Page 31
Types of performance graphs
 |
View all HP StorageWorks MSA 2/8 manuals
Add to My Manuals
Save this manual to your list of manuals |
Page 31 highlights
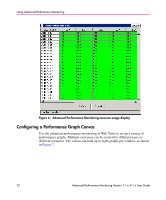
Using Advanced Performance Monitoring Vertical Bar Charts Horizontal Bar Charts Figure 5: Types of performance graphs Line Charts In addition to the charts, the Advanced Performance Monitoring Resource Usage Display (shown in Figure 6) shows which filter slots have been used for each port, and which are available. The color-coded interface makes troubleshooting easier. Advanced Performance Monitoring Version 3.1.x/4.1.x User Guide 31
-
 1
1 -
2
-
3
-
4
-
5
-
6
-
7
-
8
-
9
-
10
-
11
-
12
-
13
-
14
-
15
-
16
-
17
-
18
-
19
-
20
-
21
-
22
-
23
-
24
-
25
-
 26
26 -
 27
27 -
 28
28 -
 29
29 -
 30
30 -
 31
31 -
 32
32 -
 33
33 -
 34
34 -
 35
35 -
 36
36 -
37
-
38
-
39
-
40
-
41
-
42
-
43
-
44
-
45
-
46
-
47
-
48
-
49
-
50
-
51
-
52
-
53
-
54
-
55
-
56
-
57
-
58
-
59
-
60
-
61
-
62
-
63
-
64
-
65
-
66
-
67
-
68
-
69
-
70
-
71
-
72
-
73
-
74
-
75
-
76
-
77
-
78
-
79
-
80
-
81
-
82
-
83
-
84
-
85
-
86
 |
 |

Using Advanced Performance Monitoring
31
Advanced Performance Monitoring Version 3.1.x/4.1.x User Guide
Figure 5:
Types of performance graphs
In addition to the charts, the Advanced Performance Monitoring Resource Usage
Display (shown in
Figure 6
) shows which filter slots have been used for each port,
and which are available. The color-coded interface makes troubleshooting easier.
Line Charts
Horizontal Bar Charts
Vertical Bar Charts