HP StorageWorks MSA 2/8 HP StorageWorks Advanced Performance Monitoring V3.1.x - Page 33
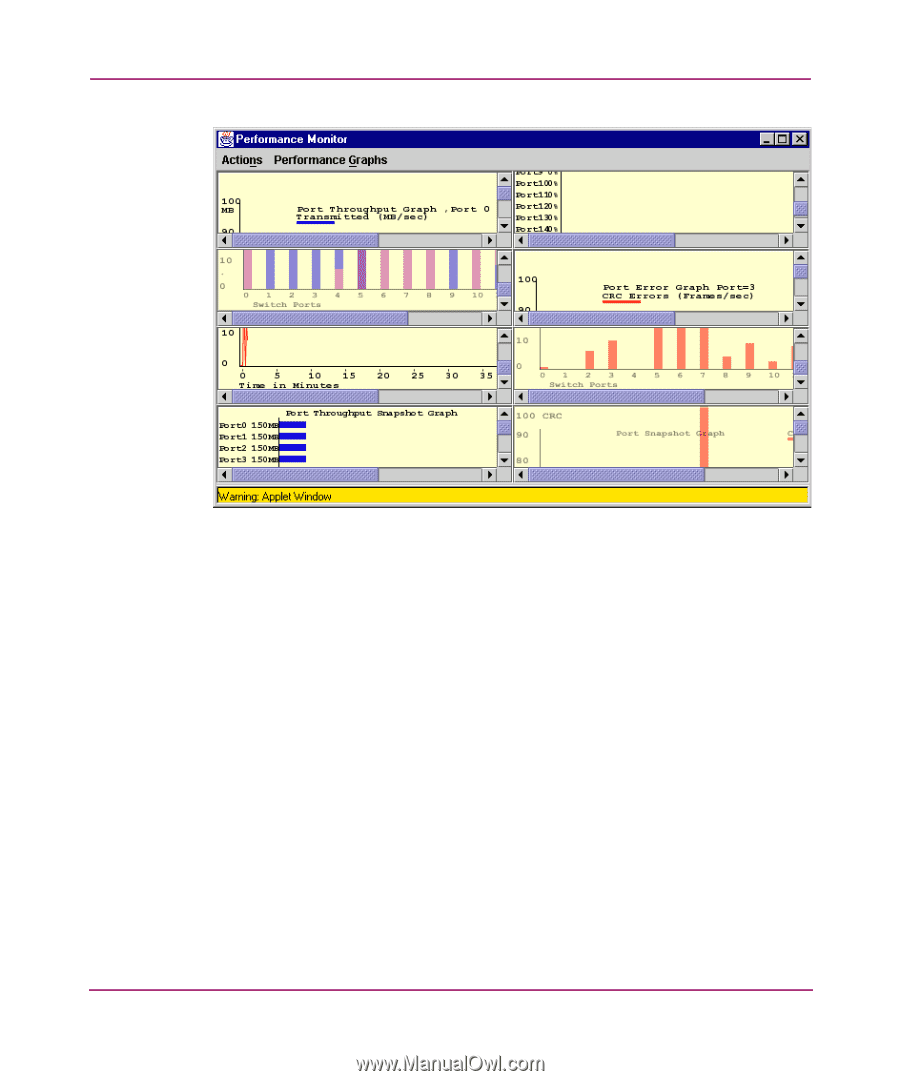
Canvas of eight performance monitoring graphs, Adding Graphs to a Canvas
 |
View all HP StorageWorks MSA 2/8 manuals
Add to My Manuals
Save this manual to your list of manuals |
Page 33 highlights
Using Advanced Performance Monitoring Figure 7: Canvas of eight performance monitoring graphs Adding Graphs to a Canvas You can add graphs to a canvas by using the Performance Graphs menu on the Performance Monitor window. Select the graph you wish to add to the canvas from either the Basic or Advanced Monitoring submenus. For a description of each of the graphs available, refer to Table 3. You can then use the Actions menu on the Performance Monitor window to: ■ Save current canvas configuration ■ Display canvas configuration ■ Display current canvas configuration ■ Print all graphs For a detailed description of the options available in the Actions menu, refer to the HP StorageWorks Web Tools Version 3.1.x/4.1.x User Guide. Advanced Performance Monitoring Version 3.1.x/4.1.x User Guide 33
-
 1
1 -
2
-
3
-
4
-
5
-
6
-
7
-
8
-
9
-
10
-
11
-
12
-
13
-
14
-
15
-
16
-
17
-
18
-
19
-
20
-
21
-
22
-
23
-
24
-
25
-
26
-
27
-
 28
28 -
 29
29 -
 30
30 -
 31
31 -
 32
32 -
 33
33 -
 34
34 -
 35
35 -
 36
36 -
 37
37 -
 38
38 -
39
-
40
-
41
-
42
-
43
-
44
-
45
-
46
-
47
-
48
-
49
-
50
-
51
-
52
-
53
-
54
-
55
-
56
-
57
-
58
-
59
-
60
-
61
-
62
-
63
-
64
-
65
-
66
-
67
-
68
-
69
-
70
-
71
-
72
-
73
-
74
-
75
-
76
-
77
-
78
-
79
-
80
-
81
-
82
-
83
-
84
-
85
-
86
 |
 |