HP StorageWorks MSA 2/8 HP StorageWorks Advanced Performance Monitoring V3.1.x - Page 43
Displaying End-to-end Monitors, Number of Fibre Channel words transmitted TX_COUNT
 |
View all HP StorageWorks MSA 2/8 manuals
Add to My Manuals
Save this manual to your list of manuals |
Page 43 highlights
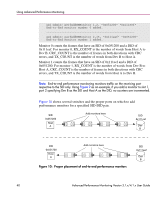
Using Advanced Performance Monitoring sw1:admin> perfSetPortEEMask 11, "00:00:ff" "00:00:ff" "00:00:ff" "00:00:ff" The EE mask on port 26 is set and EE counters are reset. sw1:admin> perfShowPortEEMask 11 The EE mask on port 26 is set by application TELNET TxSID Domain: off TxSID Area: off TxSID ALPA: on TxDID Domain: off TxDID Area: off TxDID ALPA: on RxSID Domain: off RxSID Area: off RxSID ALPA: on RxDID Domain: off RxDID Area: off RxDID ALPA: on Displaying End-to-end Monitors Use the perfShowEEMonitor command to display all the end-to-end monitors defined on a port. You can display cumulative counters or a rolling table of counters at specified intervals. This command displays the following information on all end-to-end monitors: ■ Monitor number (KEY) ■ SID ■ DID ■ CRC error count (CRC_COUNT) ■ Number of Fibre Channel words transmitted (TX_COUNT) ■ Number of Fibre Channel words received (RX_COUNT) ■ Creator application (OWNER_APP) ■ IP address of the creator, if known (OWNER_IP_ADDR) If you specify an interval number in the perfShowEEMonitor command, the command displays a rolling table of CRC error, Tx, and Rx counters on a per-interval basis for all the valid monitors on the port. The counter values are the number of bytes, in decimal format. If you omit the interval number, the command displays the cumulative transmit counter (TX_COUNT), receive counter (RX_COUNT), and CRC error counter. These cumulative counters are 64-bit values in hexadecimal format. Advanced Performance Monitoring Version 3.1.x/4.1.x User Guide 43
-
 1
1 -
2
-
3
-
4
-
5
-
6
-
7
-
8
-
9
-
10
-
11
-
12
-
13
-
14
-
15
-
16
-
17
-
18
-
19
-
20
-
21
-
22
-
23
-
24
-
25
-
26
-
27
-
28
-
29
-
30
-
31
-
32
-
33
-
34
-
35
-
36
-
37
-
 38
38 -
 39
39 -
 40
40 -
 41
41 -
 42
42 -
 43
43 -
 44
44 -
 45
45 -
 46
46 -
 47
47 -
 48
48 -
49
-
50
-
51
-
52
-
53
-
54
-
55
-
56
-
57
-
58
-
59
-
60
-
61
-
62
-
63
-
64
-
65
-
66
-
67
-
68
-
69
-
70
-
71
-
72
-
73
-
74
-
75
-
76
-
77
-
78
-
79
-
80
-
81
-
82
-
83
-
84
-
85
-
86
 |
 |
